Bilateral Analysis
Canada's exports to China: four eras in 35 years
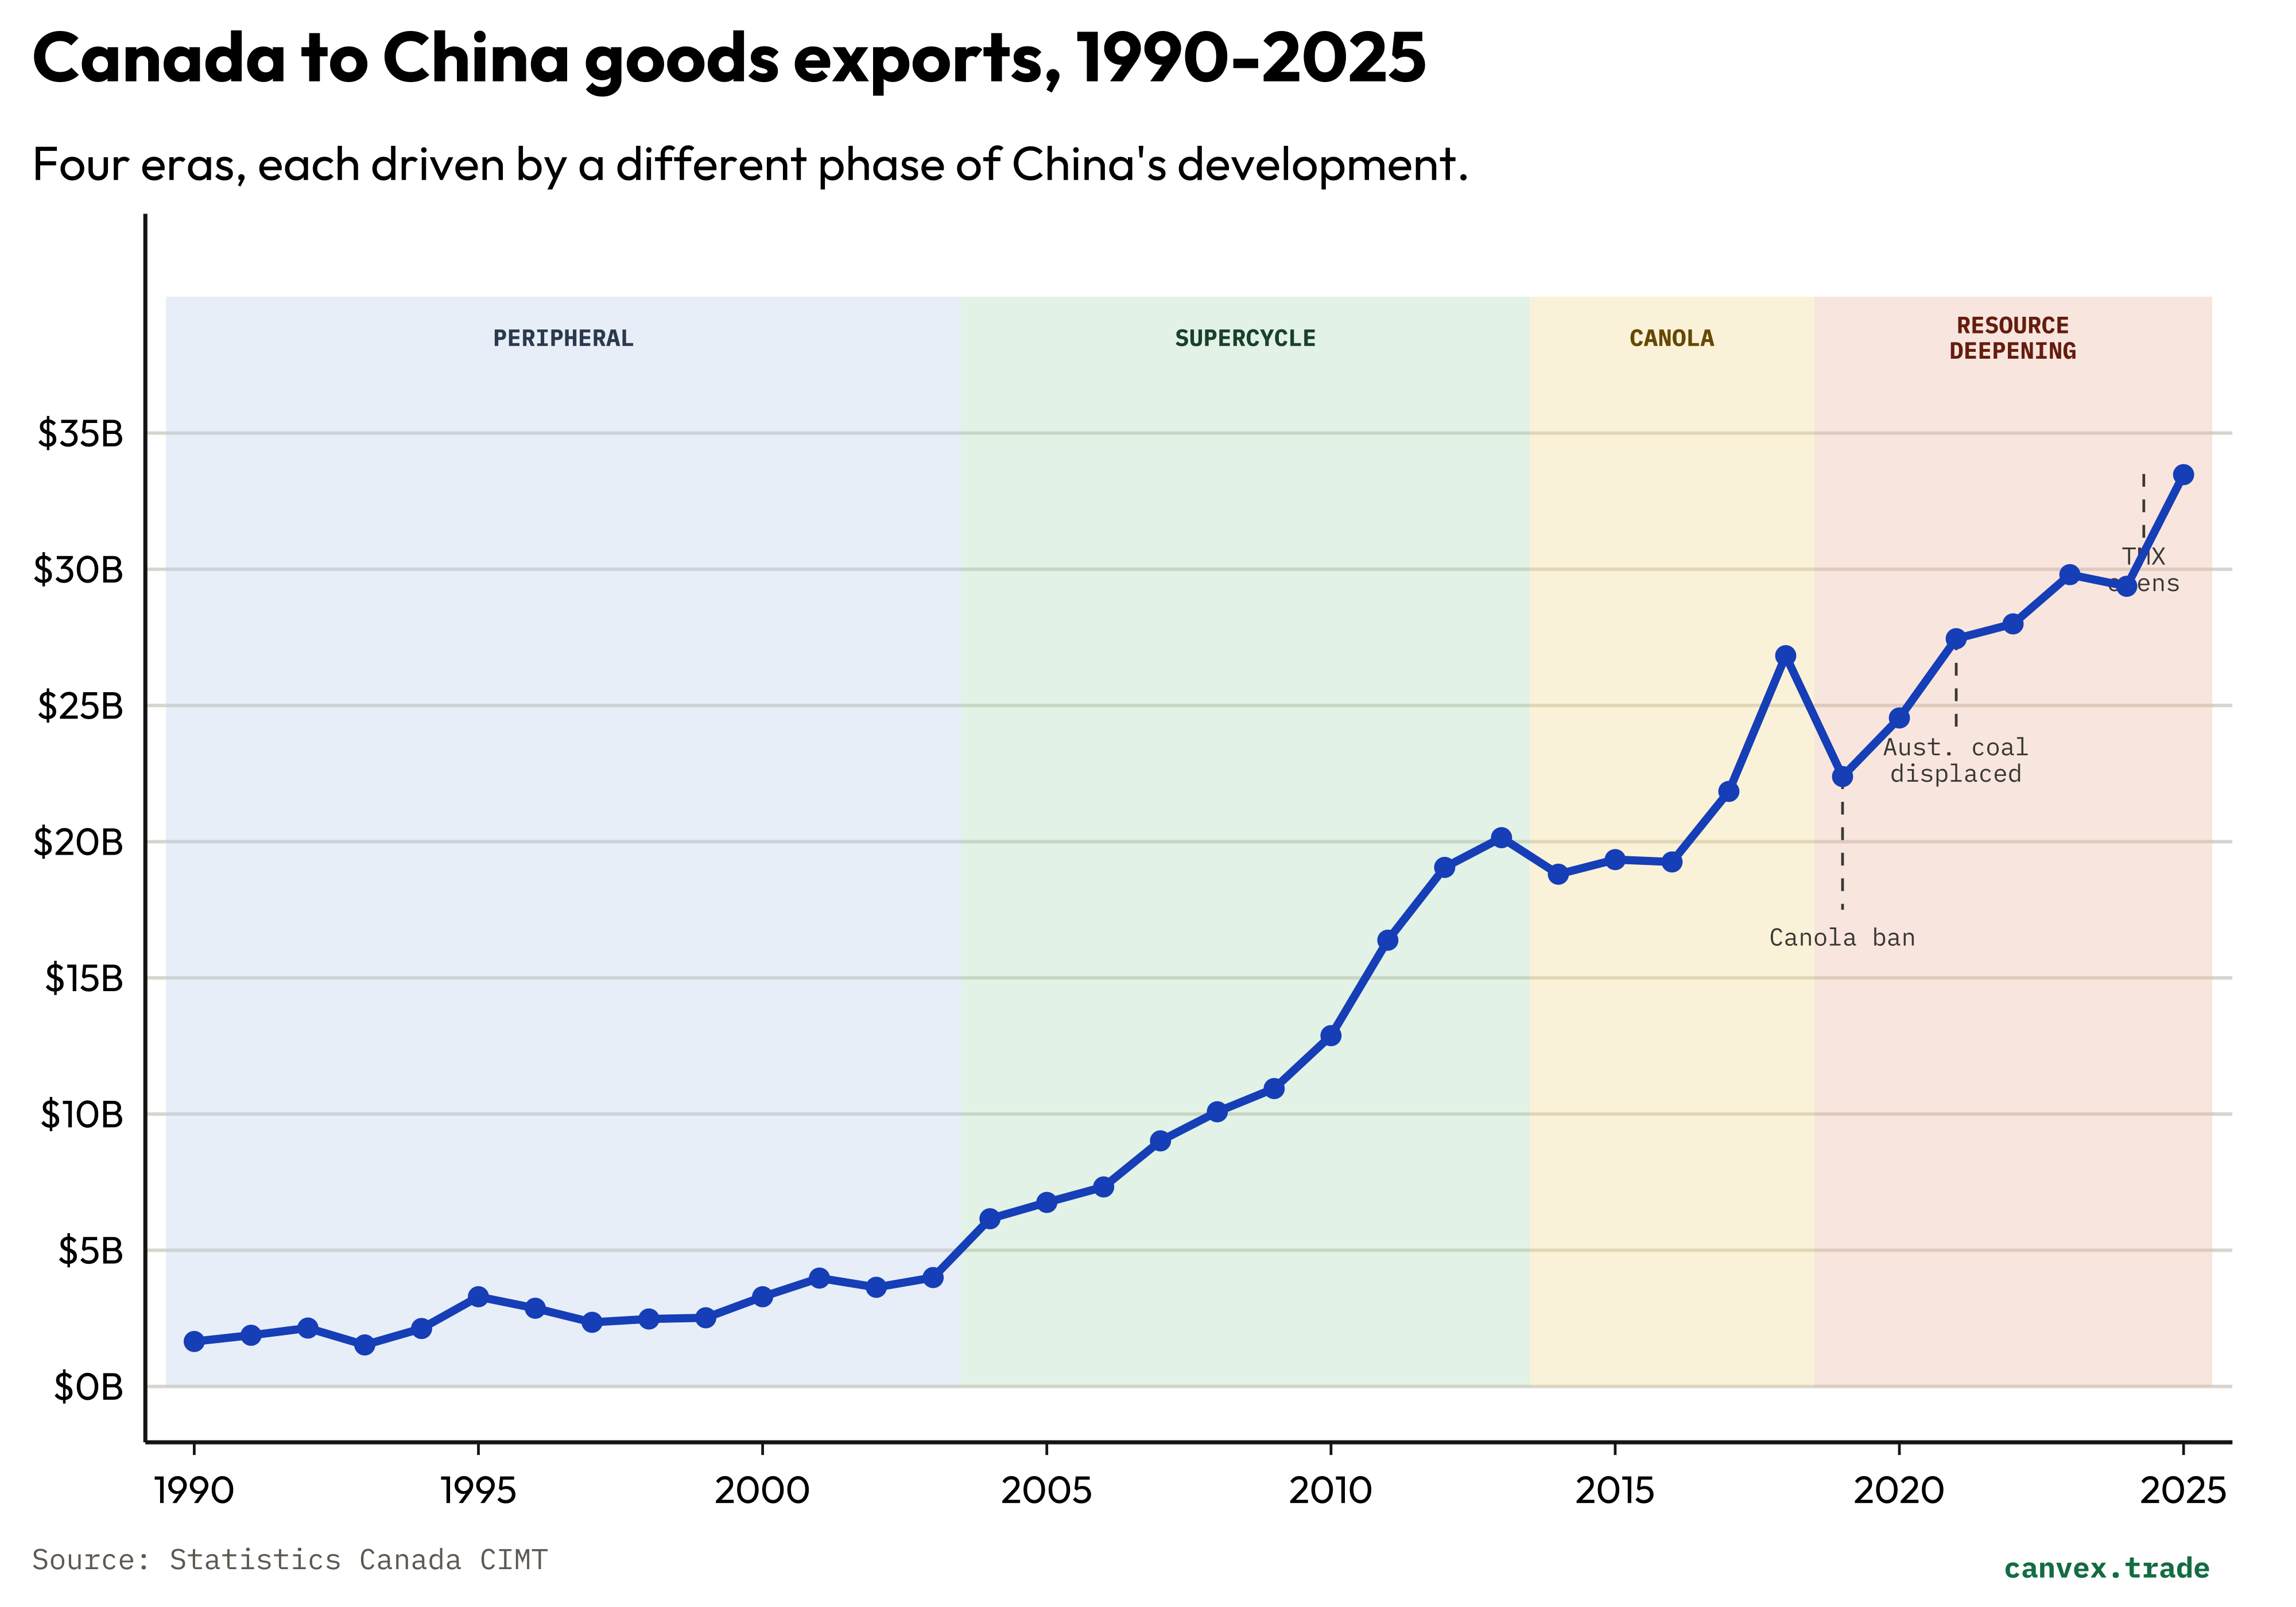
Canada's goods exports to China grew 20x between 1990 and 2025. What changed is not the relationship — it is what China needed at each stage of its own development.
Canada’s exports to China: four eras in 35 years
In 2025 Canada exported $33.5 billion of goods to China. In 1990, that number was $1.65 billion. That is a 20x increase which in nominal terms sounds like a diversification success for Canada — a second major trading relationship alongside the US anchor. However, the data reveals a more complicated story.
The economic growth was real. So were three episodes of near-stagnation, one sharp diplomatic rupture, and a structural shift in the final years that moved the relationship decisively towards raw resource extraction. China is Canada’s second-largest goods export destination, but the composition of what flows there has changed almost completely across four distinct periods — and the 2025 number is being driven by dynamics that would not have been legible even three years ago.
One constant has persisted across all four eras: Canada exports what China needs to process, not what China needs to buy finished. Iron ore for steel mills. Canola seed for crushing facilities. Crude oil to refineries. Copper scrap to smelters. The 20x growth in nominal value obscures what is structurally a supplier-processor relationship — with Canada occupying the resource end in every era and at every price level.
All figures in this piece come from Statistics Canada CIMT, HS-coded monthly merchandise trade data, 1990-2025. Explore the underlying numbers at canvex.trade.
Era 1 — The peripheral years, 1990-2003
Canada’s exports to China averaged roughly $2.5 billion per year through the 1990s and represented between 0.8% and 1.4% of total Canadian goods exports. The relationship existed but barely registered at the national level.
The composition was straightforward: agricultural and primary commodities dominated, led by wheat. In 1995 — a year of elevated agricultural prices — cereals (HS chapter 10) accounted for 37% of the $3.3 billion total at $1.22 billion. Wood pulp (HS 47) ran a consistent secondary line at $331 million (10%). Fertilizers (HS 31) added another $307 million (9%). These three categories together covered 56% of the bilateral total — all of them unprocessed inputs to Chinese industrial and food-processing operations. One notable exception was electrical and telecom equipment (HS 85), which reached $361 million (11%) in 1995, likely driven by Nortel Northern Telecom’s China sales — a manufactured-goods channel that would be largely absent from the 2025 picture.
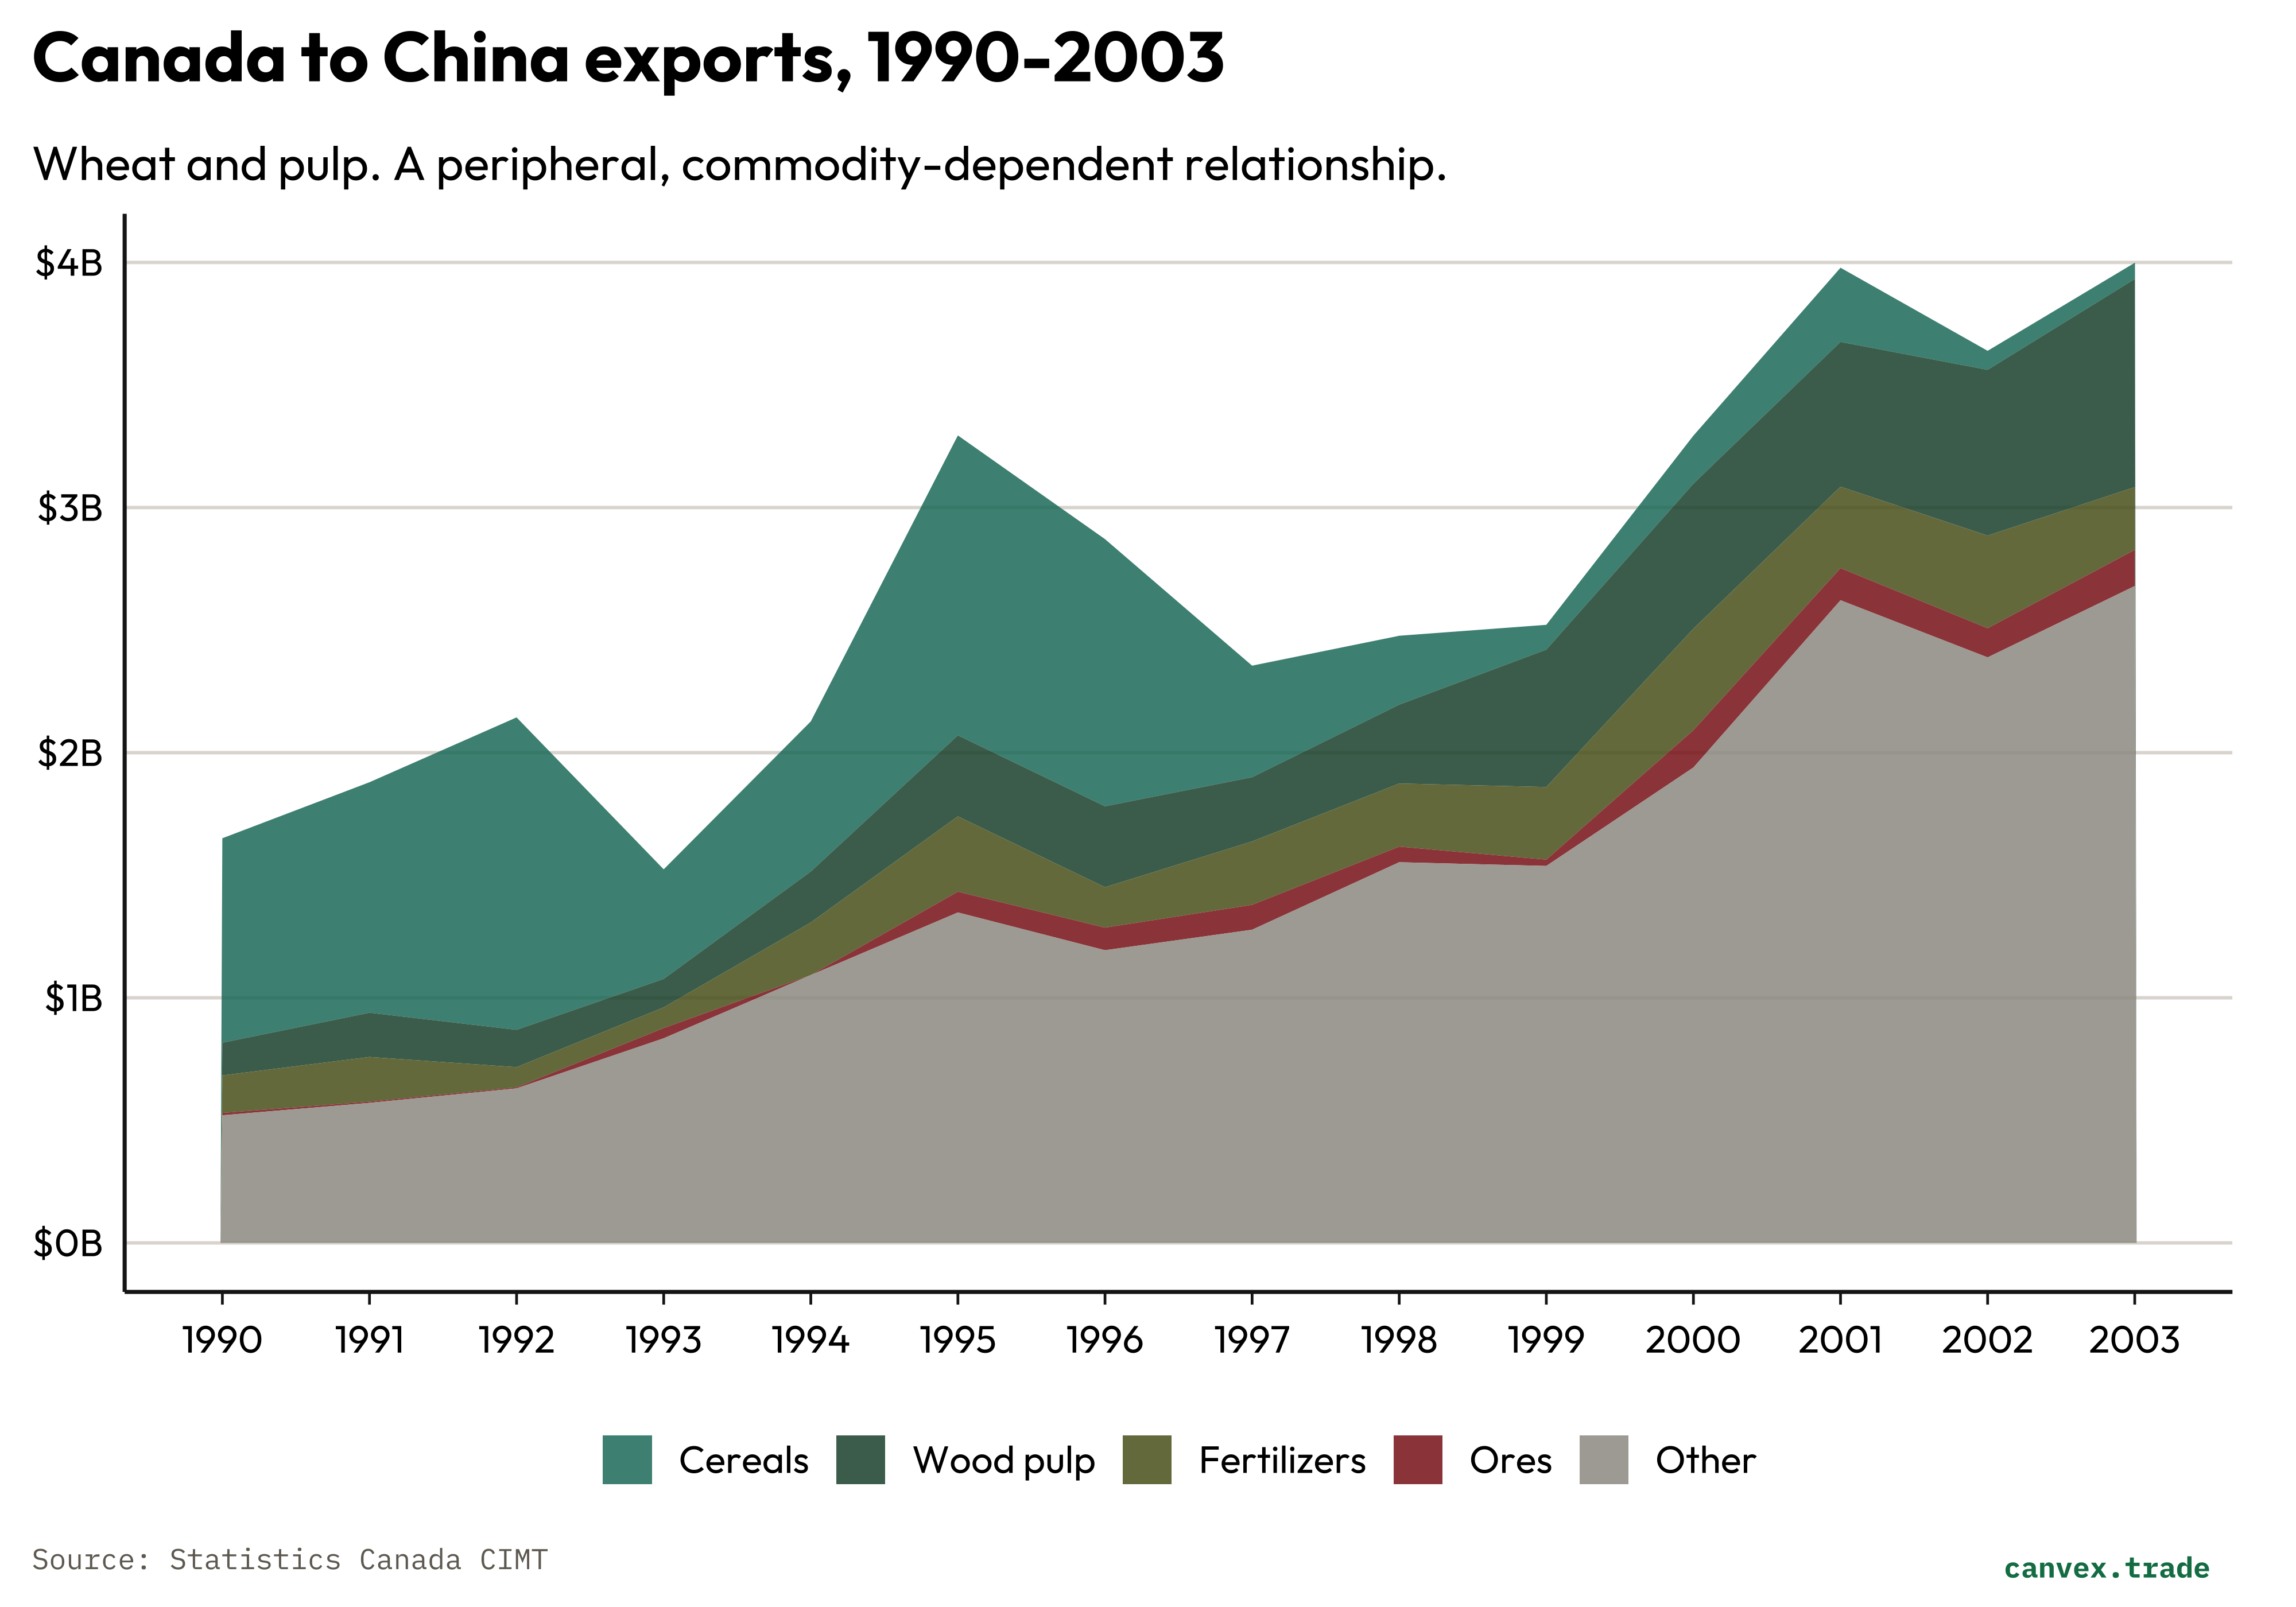
The 1993 dip (dropping from $2.1 billion to $1.5 billion) illustrates the fragility of a relationship anchored in purchases subject to short term dynamics. A strong Chinese grain harvest in 1992-1993 reduced China’s import needs sharply, and state trading enterprises dialed back wheat purchases accordingly. When Chinese production fell short again in 1994-1995, volumes recovered. The pattern was purely demand-side — Canada was a swing supplier to a buyer that purchased based on its own harvest outcomes, not on any durable trade relationship. That volatility would characterize the relationship for another decade.
The one visible structural shift is wood pulp. Pulp exports rose from $0.13 billion in 1990 to $0.85 billion by 2003 as China’s paper and packaging industries began scaling. This was the early signal of the demand pull that would dominate the next era.
Era 2 — The supercycle, 2004-2013
China’s accession to the WTO in 2001 did not immediately show up in Canadian export data. The lag lasted until roughly 2003-2004, when the infrastructure and manufacturing investment cycle that followed WTO accession generated a step-change in raw material demand of the Chinese market.
Canadian exports to China grew from $4.0 billion in 2003 to $20.2 billion in 2013 — a five-fold increase in a decade, with the share of total Canadian exports goods climbing from 1.1% to 4.5%.
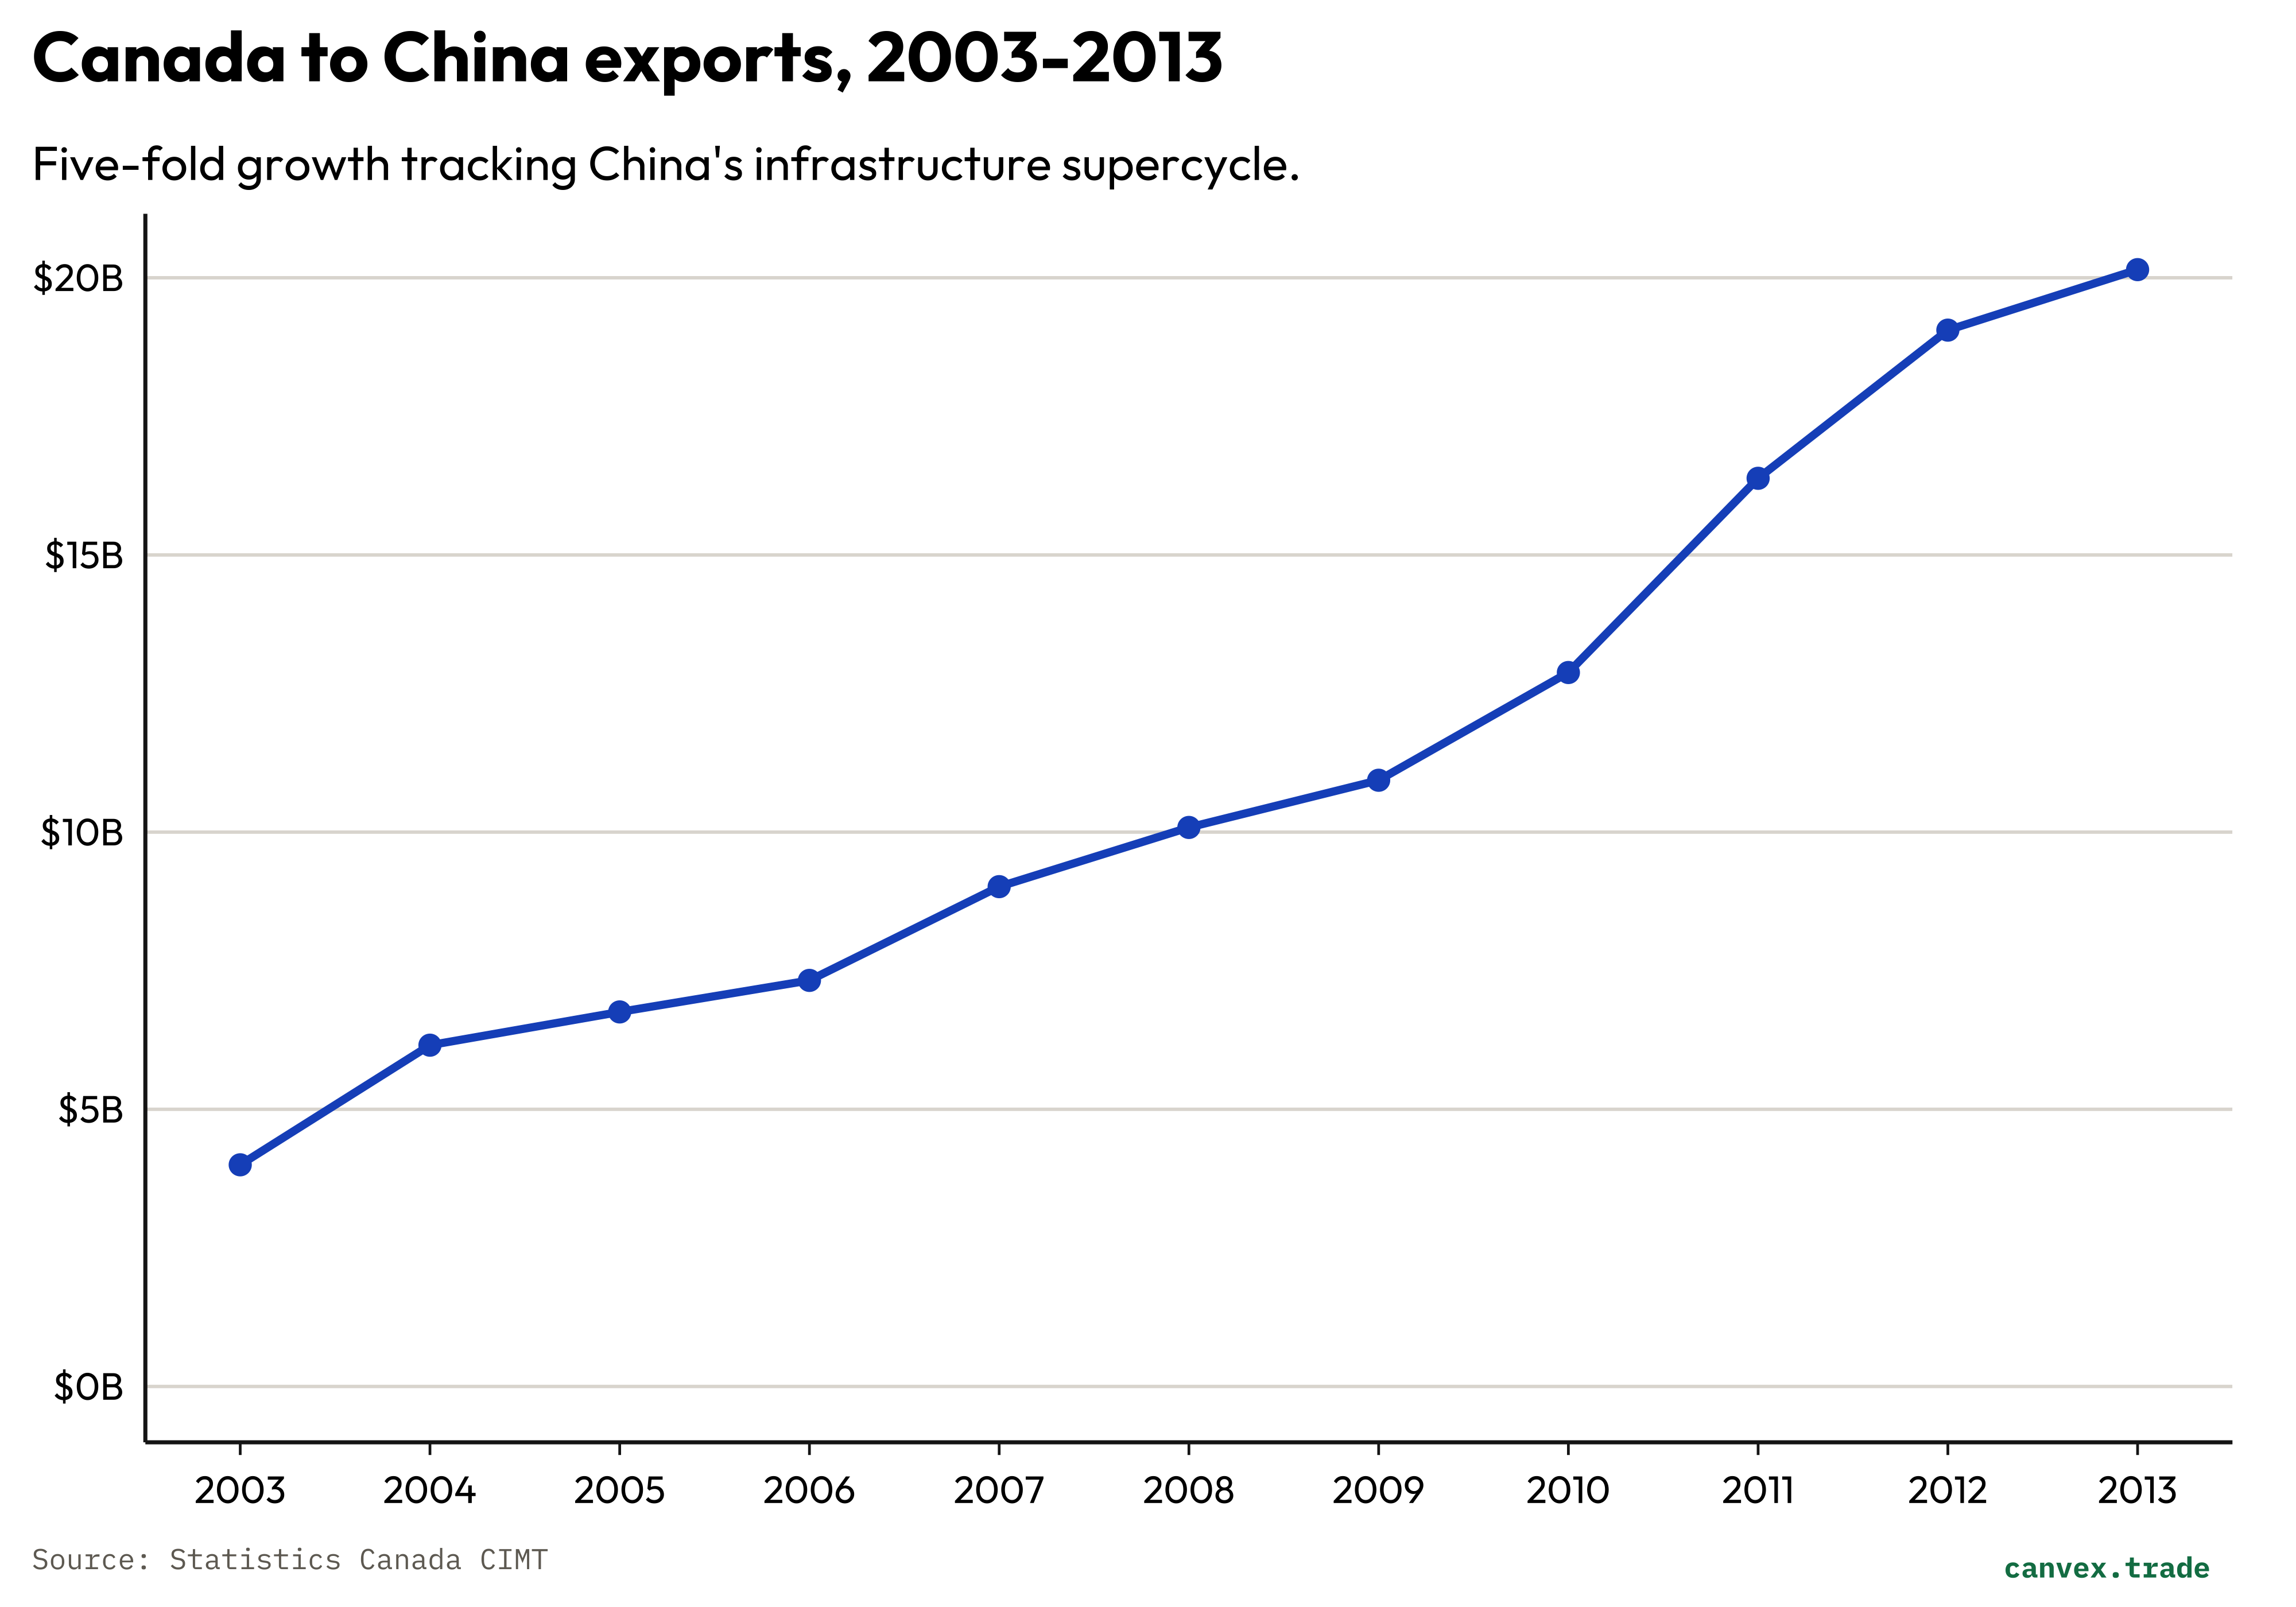
What actually drove the expansion was three commodity categories — iron ore, wood pulp, and canola — each responding to different Chinese demand drivers.
Iron ore (HS heading 2601) went from near-zero in the early 2000s to $1.97 billion by 2013. Canada is not a top-tier global iron ore producer, but BC’s iron ore concentrates entered the trade as Chinese steel output expanded from 160 million tonnes in 2000 to 779 million tonnes by 2013. (What value did this represent? if from tonnes?) The price spike in the 2009-2013 window amplified the value significantly: ores moved from $0.90 billion in 2009 to $3.11 billion in 2013 even as volume gains were more modest.
Wood pulp tracked China’s paper industry. Canadian softwood fibre is a quality input for packaging and printing grades. The category grew from $0.85 billion (2003) to $2.73 billion (2013) and was remarkably durable — it held up through the 2008-2009 financial crisis even as other exports declined.
Canola seed and oilseeds (HS chapter 12) emerged as the third major leg. The dominant product within the chapter is rapeseed/canola seed (HS 1205), which China imports as a raw crush input: domestic facilities press the seed for edible oil and produce canola meal as a co-product used in animal feed. Canada exports the unprocessed seed; the value-add of extraction and processing accrues in China. This follows the same pattern as pulp and ore — Canada is the upstream supplier to a Chinese processing industry. The channel grew from $0.14 billion (2003) to $2.37 billion (2013), and by 2013 represented nearly 12% of the bilateral trade total.
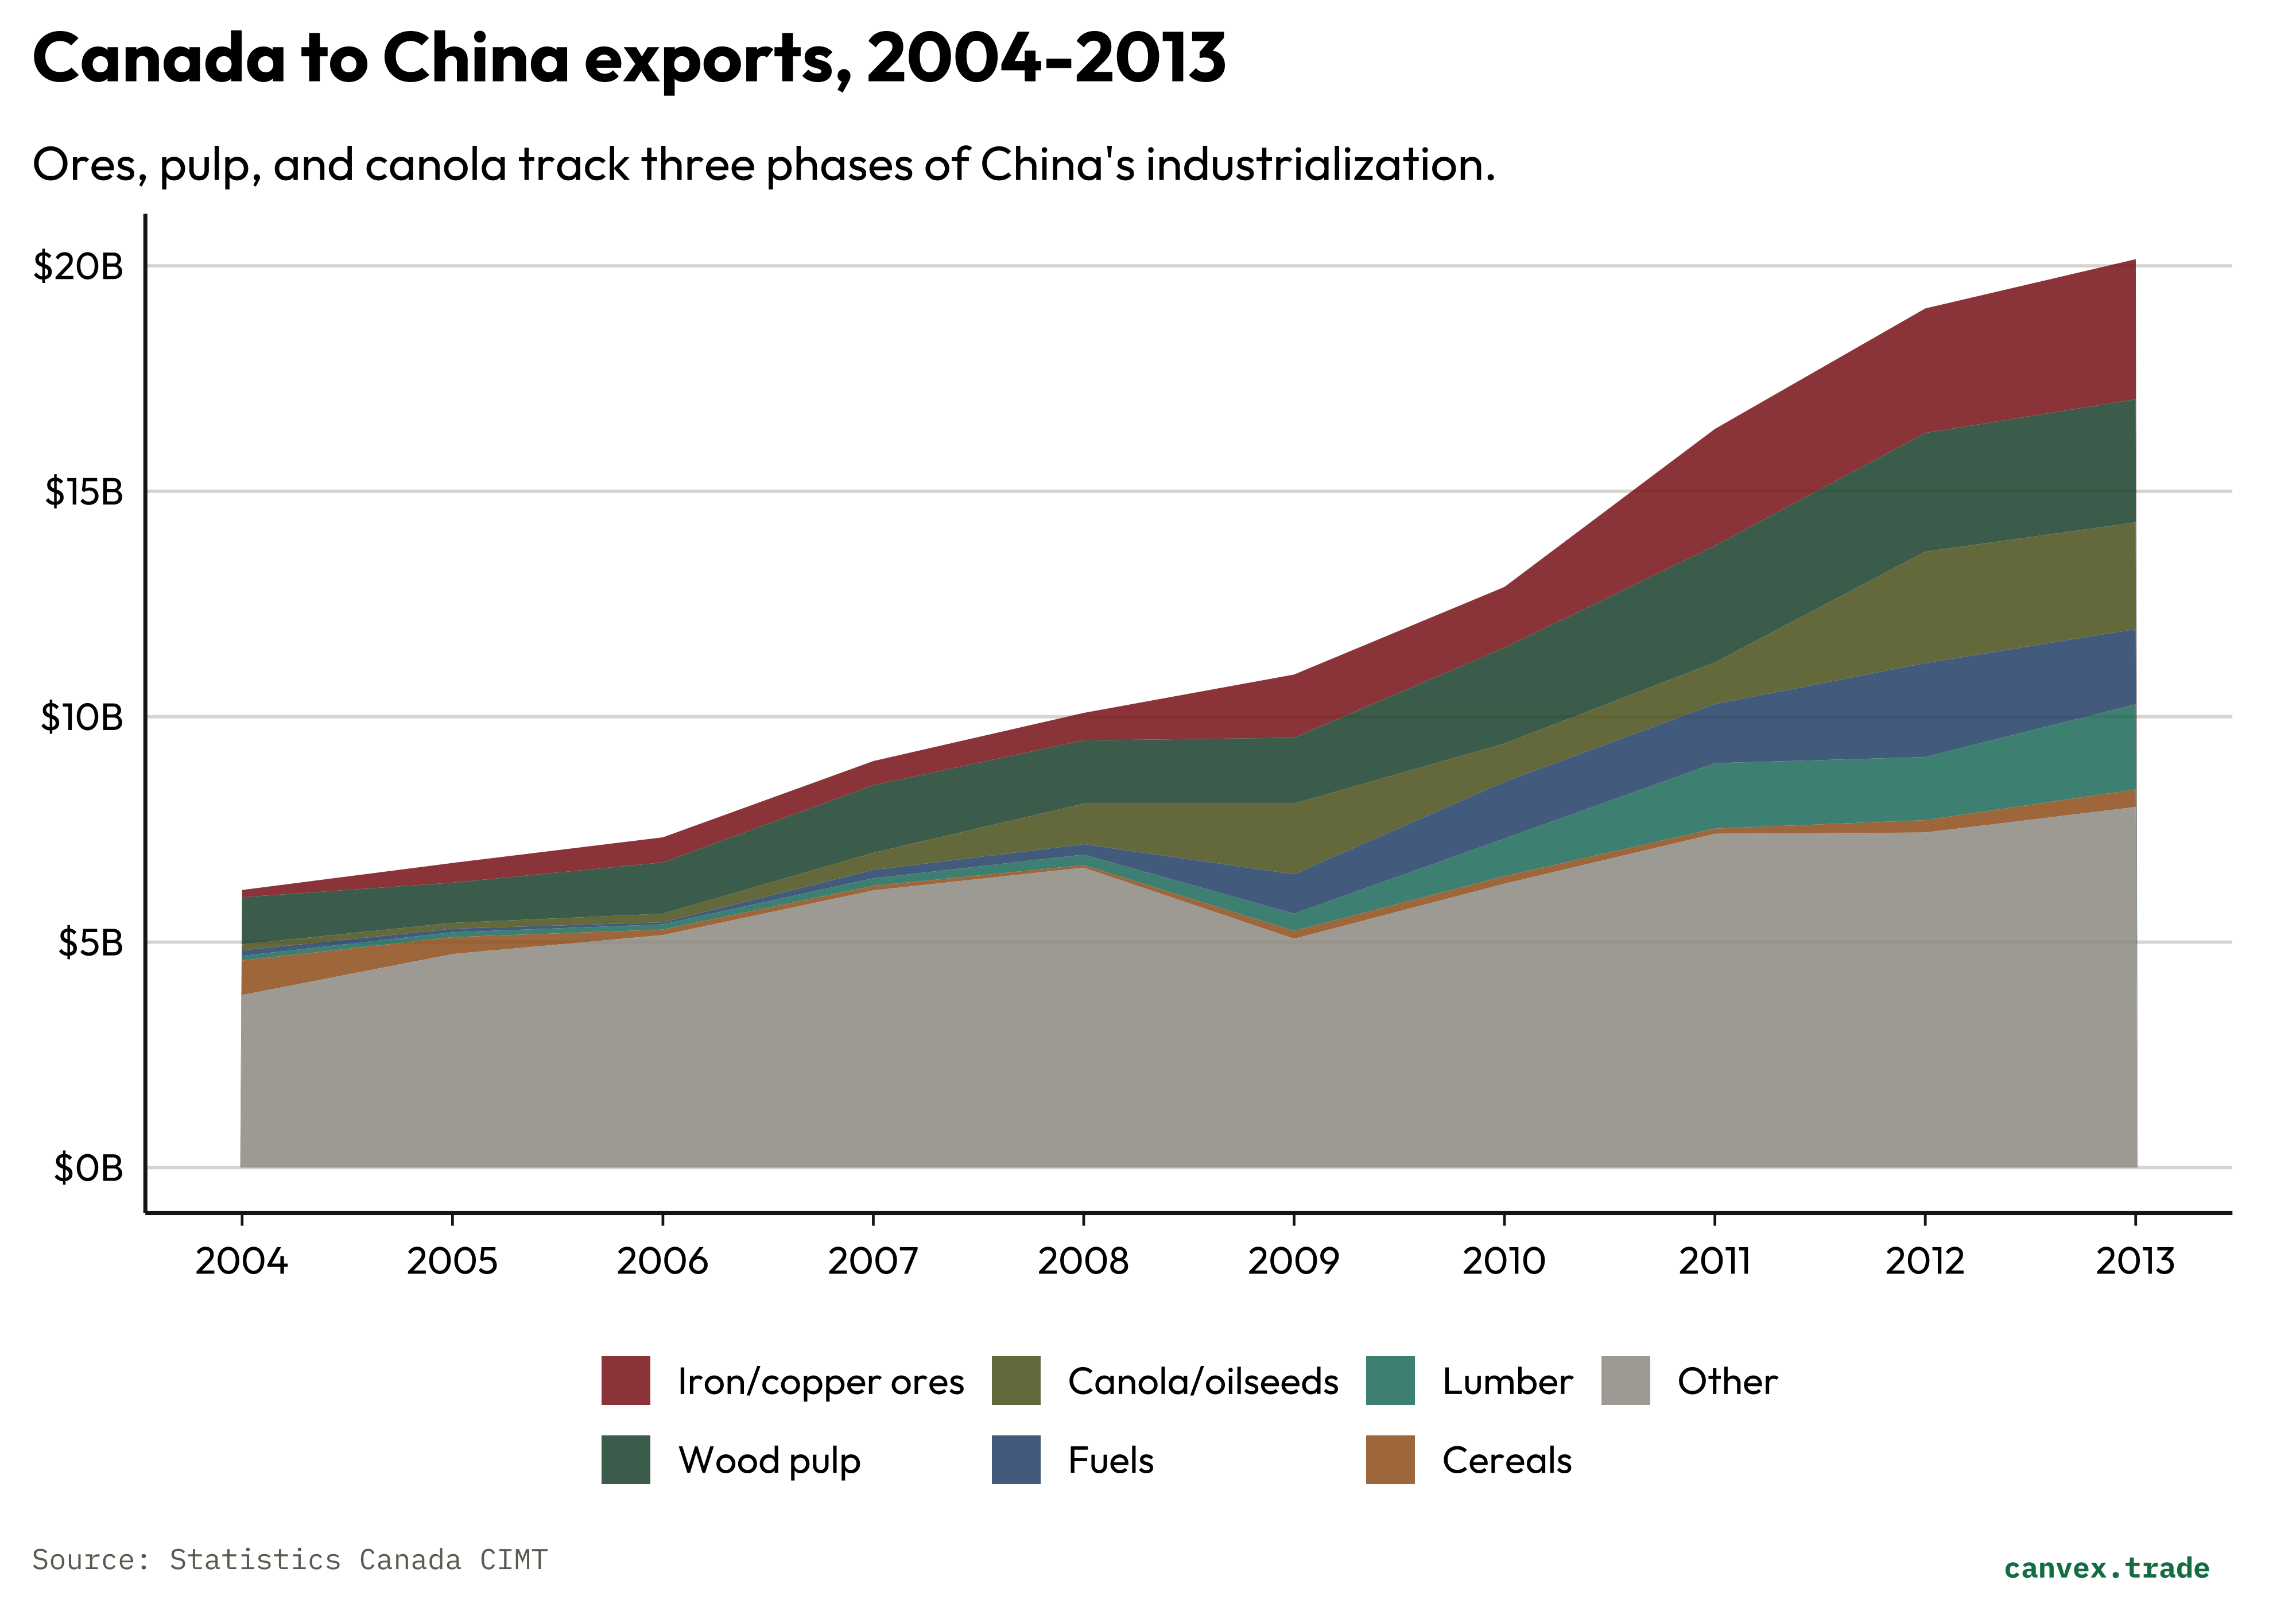
One counterintuitive data point from this era: the 2008-2009 financial crisis was a non-event for the Canada-China corridor. While total Canadian exports fell 26.5% in 2009, China exports rose from $10.1 billion (2008) to $10.9 billion (2009). China’s $586 billion stimulus package that year generated immediate demand for steel (iron ore), pulp (packaging for manufactured goods), and canola (food security). The bilateral share of total Canadian exports jumped from 2.2% to 3.3% in a single year — not because of any policy shift, but because China was buying while everyone else was not.
Era 3 — The canola chapter, 2014-2018
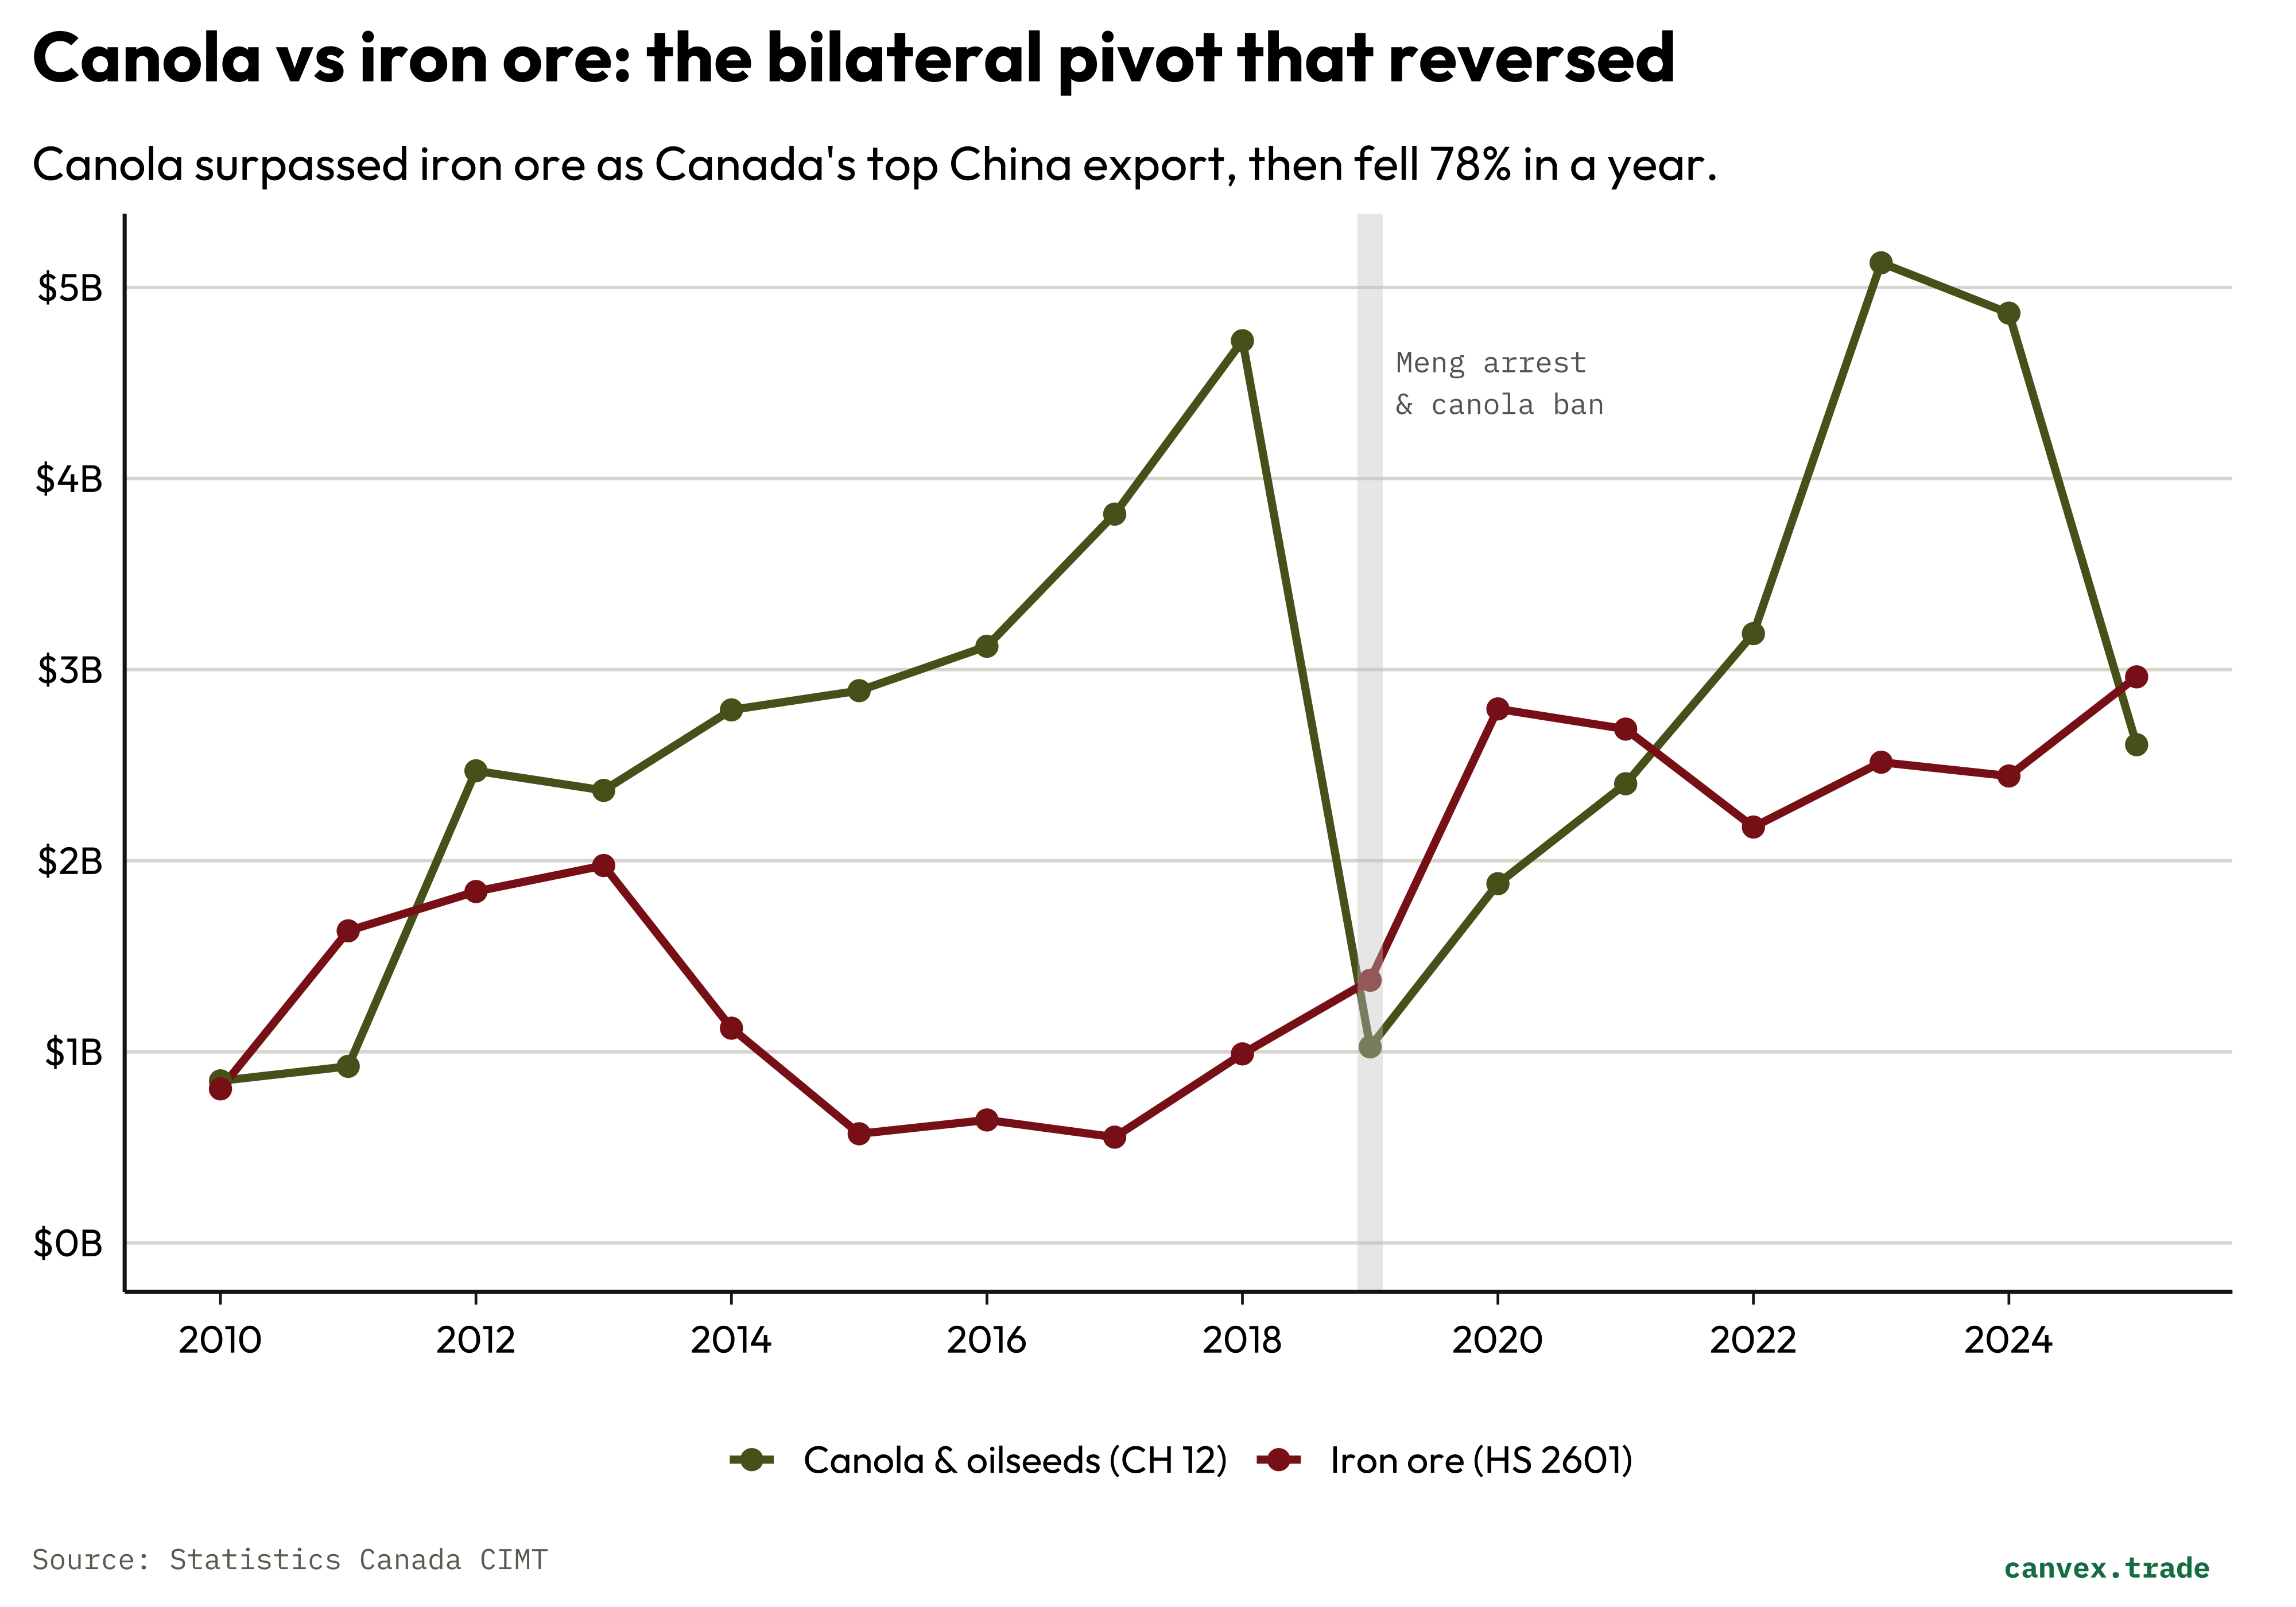
The five years between 2014 and 2018 saw exports plateau in absolute terms but consolidate in composition. Canola displaced ores as the largest single category, and the relationship appeared to be reverting back to an agricultural goods driven relationship.
Total exports oscillated between $18.8 billion (2014) and $26.8 billion (2018). The pattern masks an important change underneath: as Chinese steel demand decelerated after the 2013 peak in infrastructure investment, iron ore prices fell sharply and the dollar value of Canadian ore exports dropped from $3.1 billion (2013) to $0.6 billion (2015). Canola filled the gap.
By 2018, canola and oilseeds represented 17.6% of the bilateral total at $4.72 billion — the single largest category, ahead of wood pulp ($4.13 billion). The shift made the relationship look more balanced, but it concentrated exposure in a category with significant political sensitivity: agricultural imports are a tool Chinese officials have used as economic leverage in past disputes with Australia, the US, and others.
By the end of 2018 the relationship was more agricultural than it had been in a decade — and more concentrated in a single category subject to import licensing than most observers recognised.
Era 4 — Rupture and resource deepening, 2019-2025
The arrest of Meng Wanzhou — Huawei’s CFO — in Vancouver in December 2018, on a US extradition request, triggered the most visible single-year disruption in Canada-China trade in the available data.
China’s response was targeted and documented. In March 2019, two major Canadian canola exporters lost their import licences citing pest contamination — a finding that Canadian regulators disputed. The data are unambiguous: canola exports collapsed from $4.72 billion (2018) to $1.03 billion (2019), a $3.70 billion decline that represented 84% of the total $4.4 billion drop in bilateral exports that year. No other category came close.
What the data also show is that China did not substantially compensate with increased purchases of other Canadian commodities elsewhere. Pulp exports fell $0.6 billion (15%) from their 2018 peak of $4.13 billion. Most other categories were flat or marginally down. Only iron ore gained meaningfully (+$0.77 billion).
The canola ban was partially lifted through 2020-2022 as diplomatic relations normalized following the Meng extradition proceedings and her eventual return to China in September 2021. By 2023, canola had recovered to $5.13 billion — its highest level ever. But the episode established a durable pattern: agricultural exports subject to import licensing can be eliminated in a single regulatory action, and Canada’s limited ability to redirect billions in commodity flows means the channel offers asymmetric leverage to Beijing.
The more consequential development in this era is the structural shift in the resource mix. Two commodity channels that barely existed in 2020 have become the dominant story by 2025.
Coal (HS heading 2701) went from roughly $0.7-0.9 billion annually through the 2010s to $3.49 billion in 2021. The trigger was external: Australia’s coal exports to China were effectively blocked from late 2020 following a deterioration in Australia-China relations. Canadian metallurgical coal from BC — particularly from the Elk Valley — found a larger market. The coal channel stayed elevated at $2.5-3.5 billion through 2022-2025.
Crude oil (HS heading 2709) is the more striking story. Canadian crude exports to China were negligible for most of the historical period — under $0.5 billion in most years, and near zero in several. In 2024 they reached $2.45 billion. In 2025 they reached $6.29 billion. The enabling infrastructure was the Trans Mountain Expansion (TMX) pipeline, which entered service in May 2024, tripling the capacity of the Trans Mountain Pipeline from Edmonton to the Westridge Marine Terminal in Burnaby. TMX makes tidewater loading of Alberta crude viable at scale. China is the primary destination.
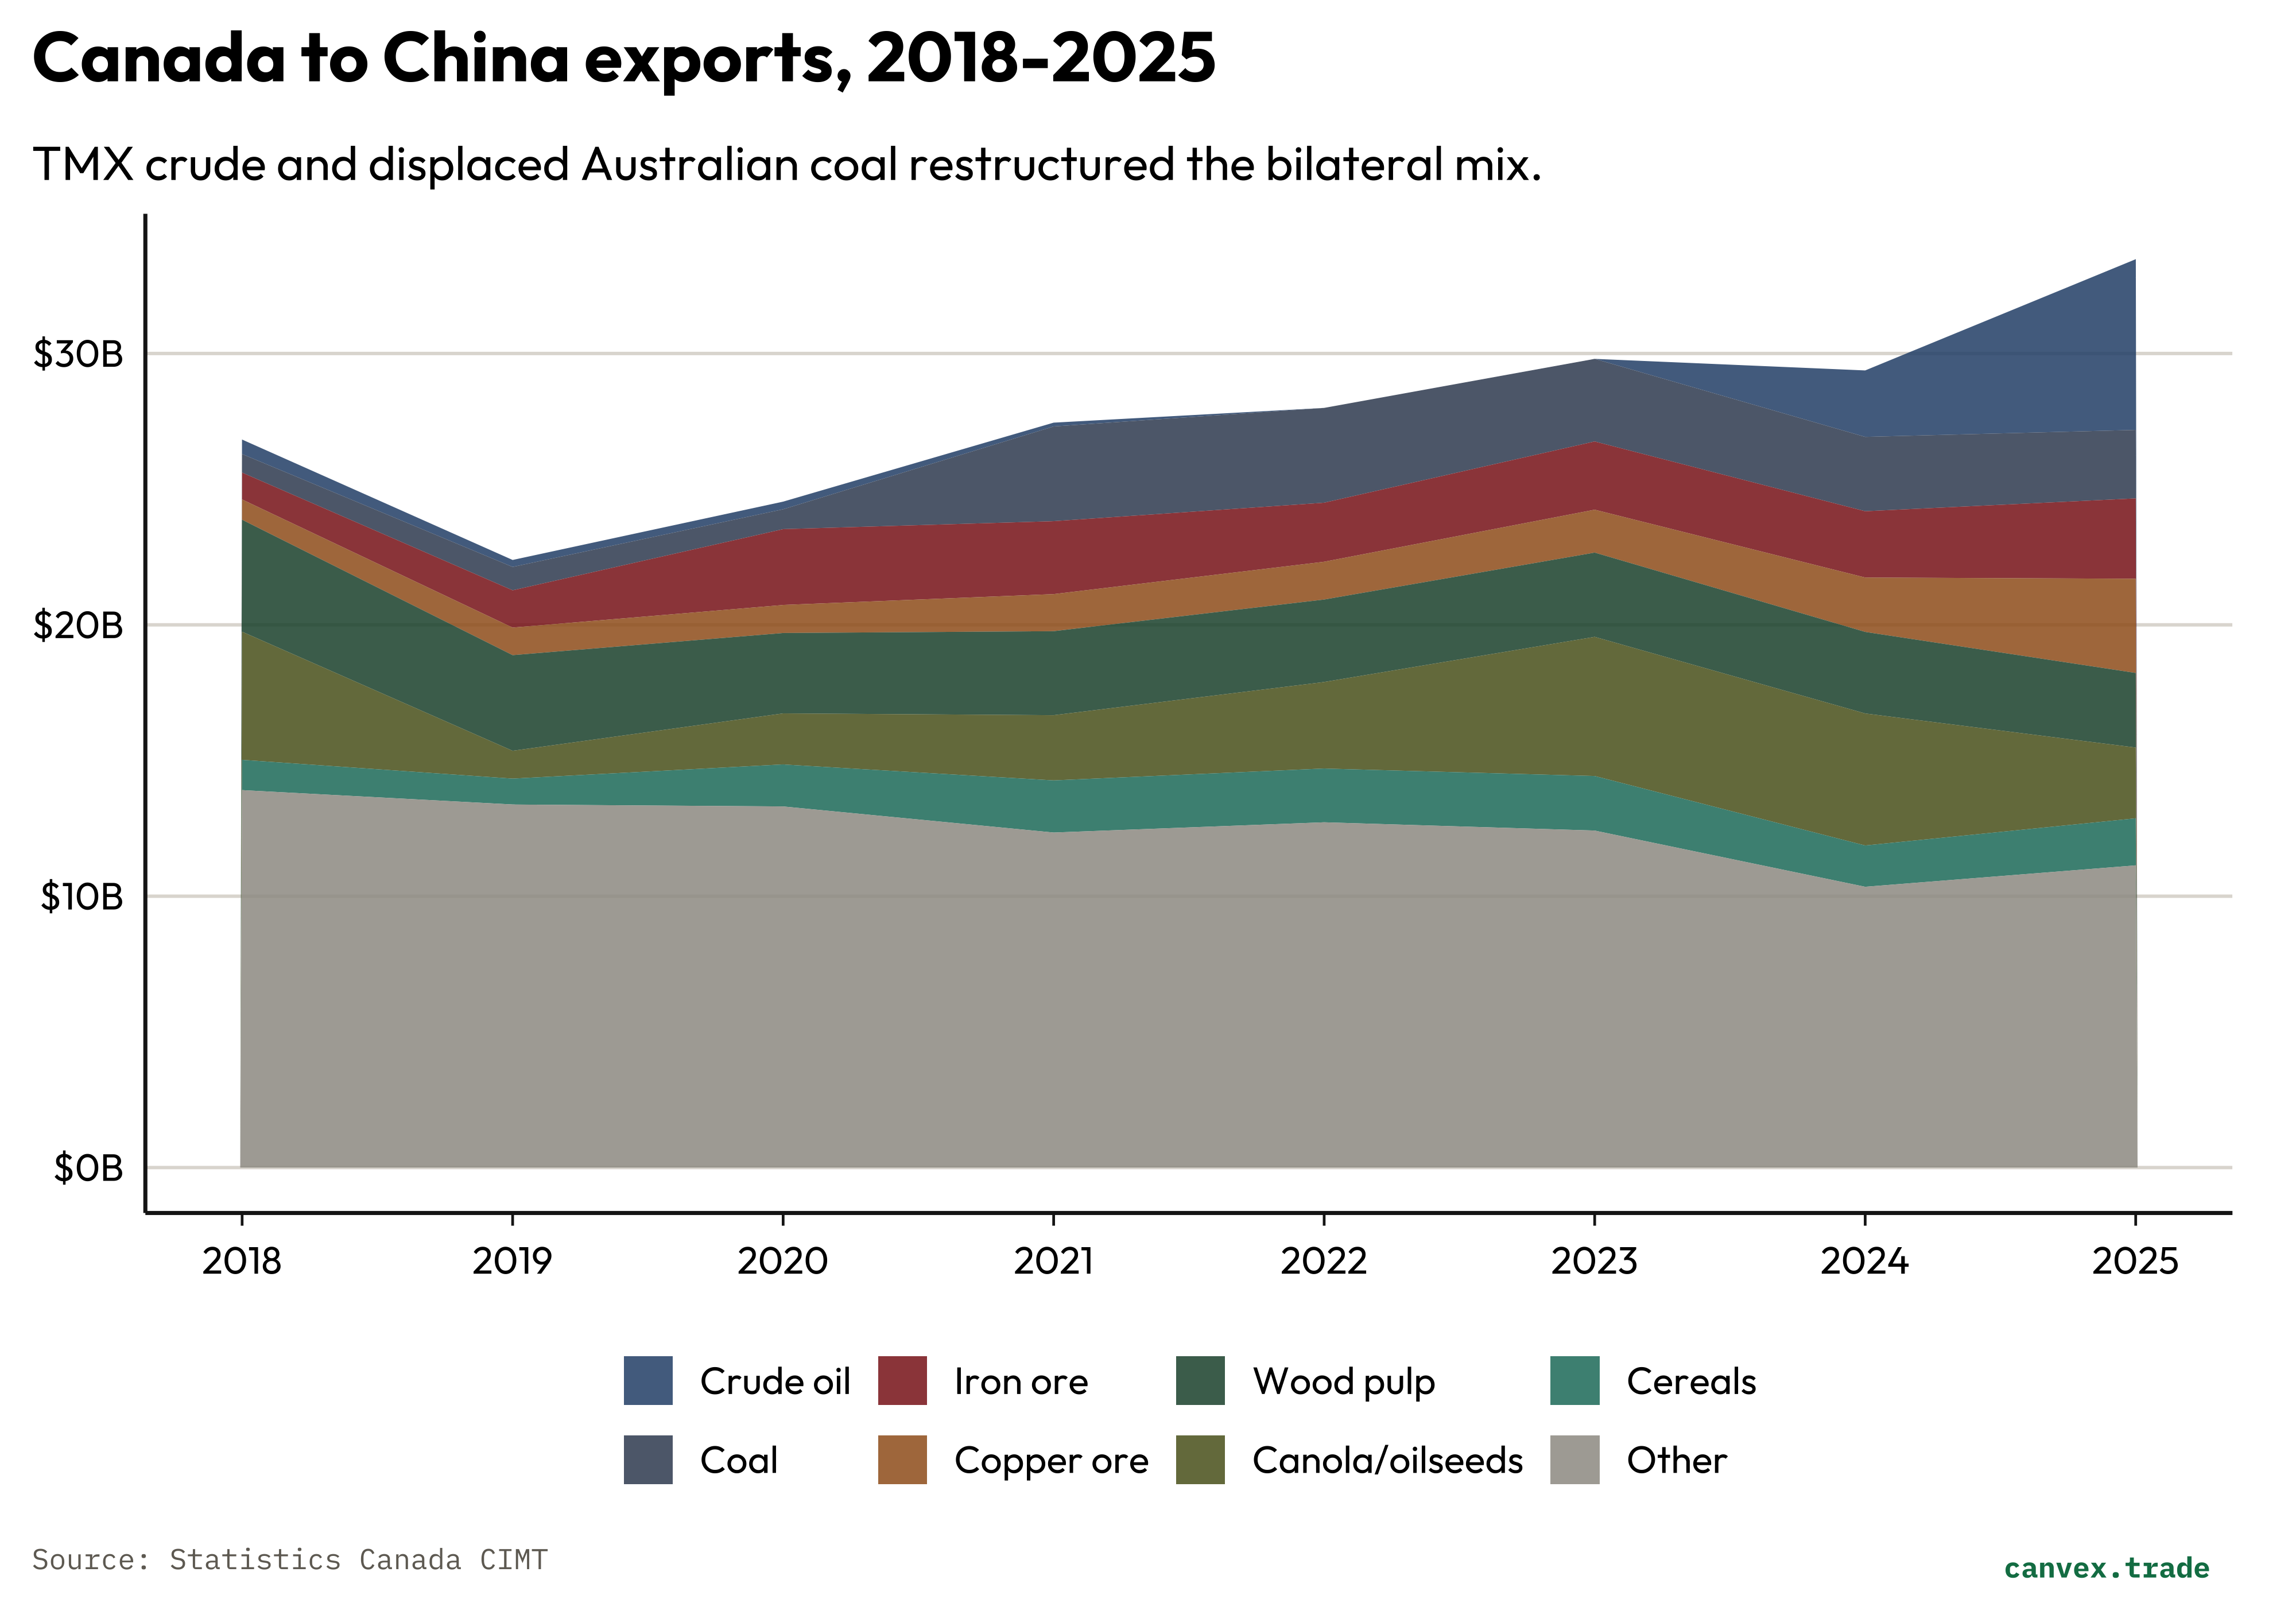
A third resource channel gaining momentum is copper ore (HS heading 2603). Copper exports to China grew from $0.75 billion (2018) to $3.47 billion (2025), tracking China’s demand for copper in EV manufacturing, power grid expansion, and renewable energy deployment. Unlike the coal channel (which is a displacement of Australian supply) or the crude channel (which required TMX infrastructure), copper ore growth reflects durable structural demand: each battery-electric vehicle requires roughly 80 kg of copper versus 23 kg in a combustion vehicle, and China’s grid buildout for solar and wind integration is copper-intensive at scale. BC ships copper concentrates to Chinese smelters, which refine them for downstream supply chains — Canada supplies the ore; China captures the smelting and fabrication margin.
The food corridor: size, consistency, and what the data actually shows
Canada is often described as a trusted, high-quality food supplier to China — a natural fit between Canadian agricultural advantage and Chinese consumer appetite for premium imported products. The data tests that framing. Across the six main food and agricultural categories trackable from 2015 to 2025, the dominant pattern is not stable brand-driven demand but volatility, opportunism, and structural vulnerability. Most of the large numbers in Canadian food exports to China are explained by events Canada did not control.
Lobster and crustaceans are the clearest case of genuine consumer-driven demand — and the exception that proves the rule. Exports of HS heading 0306 grew from $306 million in 2012 to a peak of $1.12 billion in 2023, anchored in Chinese consumer appetite for Atlantic lobster, live crab, and spot prawns. The channel eased to $629 million in 2025 but has held above $600 million in most years since 2019. Unlike canola, crustacean trade is not subject to import licensing structures and has so far been insulated from bilateral disputes. Lobster is probably the strongest evidence for the premium supplier framing — and at roughly $600-900 million it is a modest channel against the $33.5 billion bilateral total.
Pork is the opposite story. Canadian pork exports to China were $383 million in 2018. African Swine Fever (ASF), which entered China’s herd in 2018, ultimately eliminated an estimated 40% of the country’s pig population by 2019. China needed protein urgently and Canadian pork exports responded: the channel surged to $1.45 billion in 2020 — a near-quadrupling in two years driven by a disease shock, not by Canada’s reputation or any structural preference for Canadian pork. As China rebuilt its herd through 2021-2023, the channel collapsed with equal speed. Pork exports stood at $109 million in 2025 — below the pre-ASF baseline. The entire episode, a swing of over $1 billion in either direction, was driven by Chinese domestic animal health. Canada was a swing supplier to an emergency.
Offal has been more durable than muscle cuts. Edible offal (HS heading 0206) — pork stomachs, hearts, livers, and intestines — grew from $68 million (2015) to $245 million (2025) with considerably less volatility. The reason is structural complementarity: China’s culinary tradition values organ meats that Canadian domestic consumption does not. Canada exports a co-product it would otherwise discard at low value. This channel works because of difference, not quality premium, and it has held through diplomatic turbulence that disrupted other food categories.
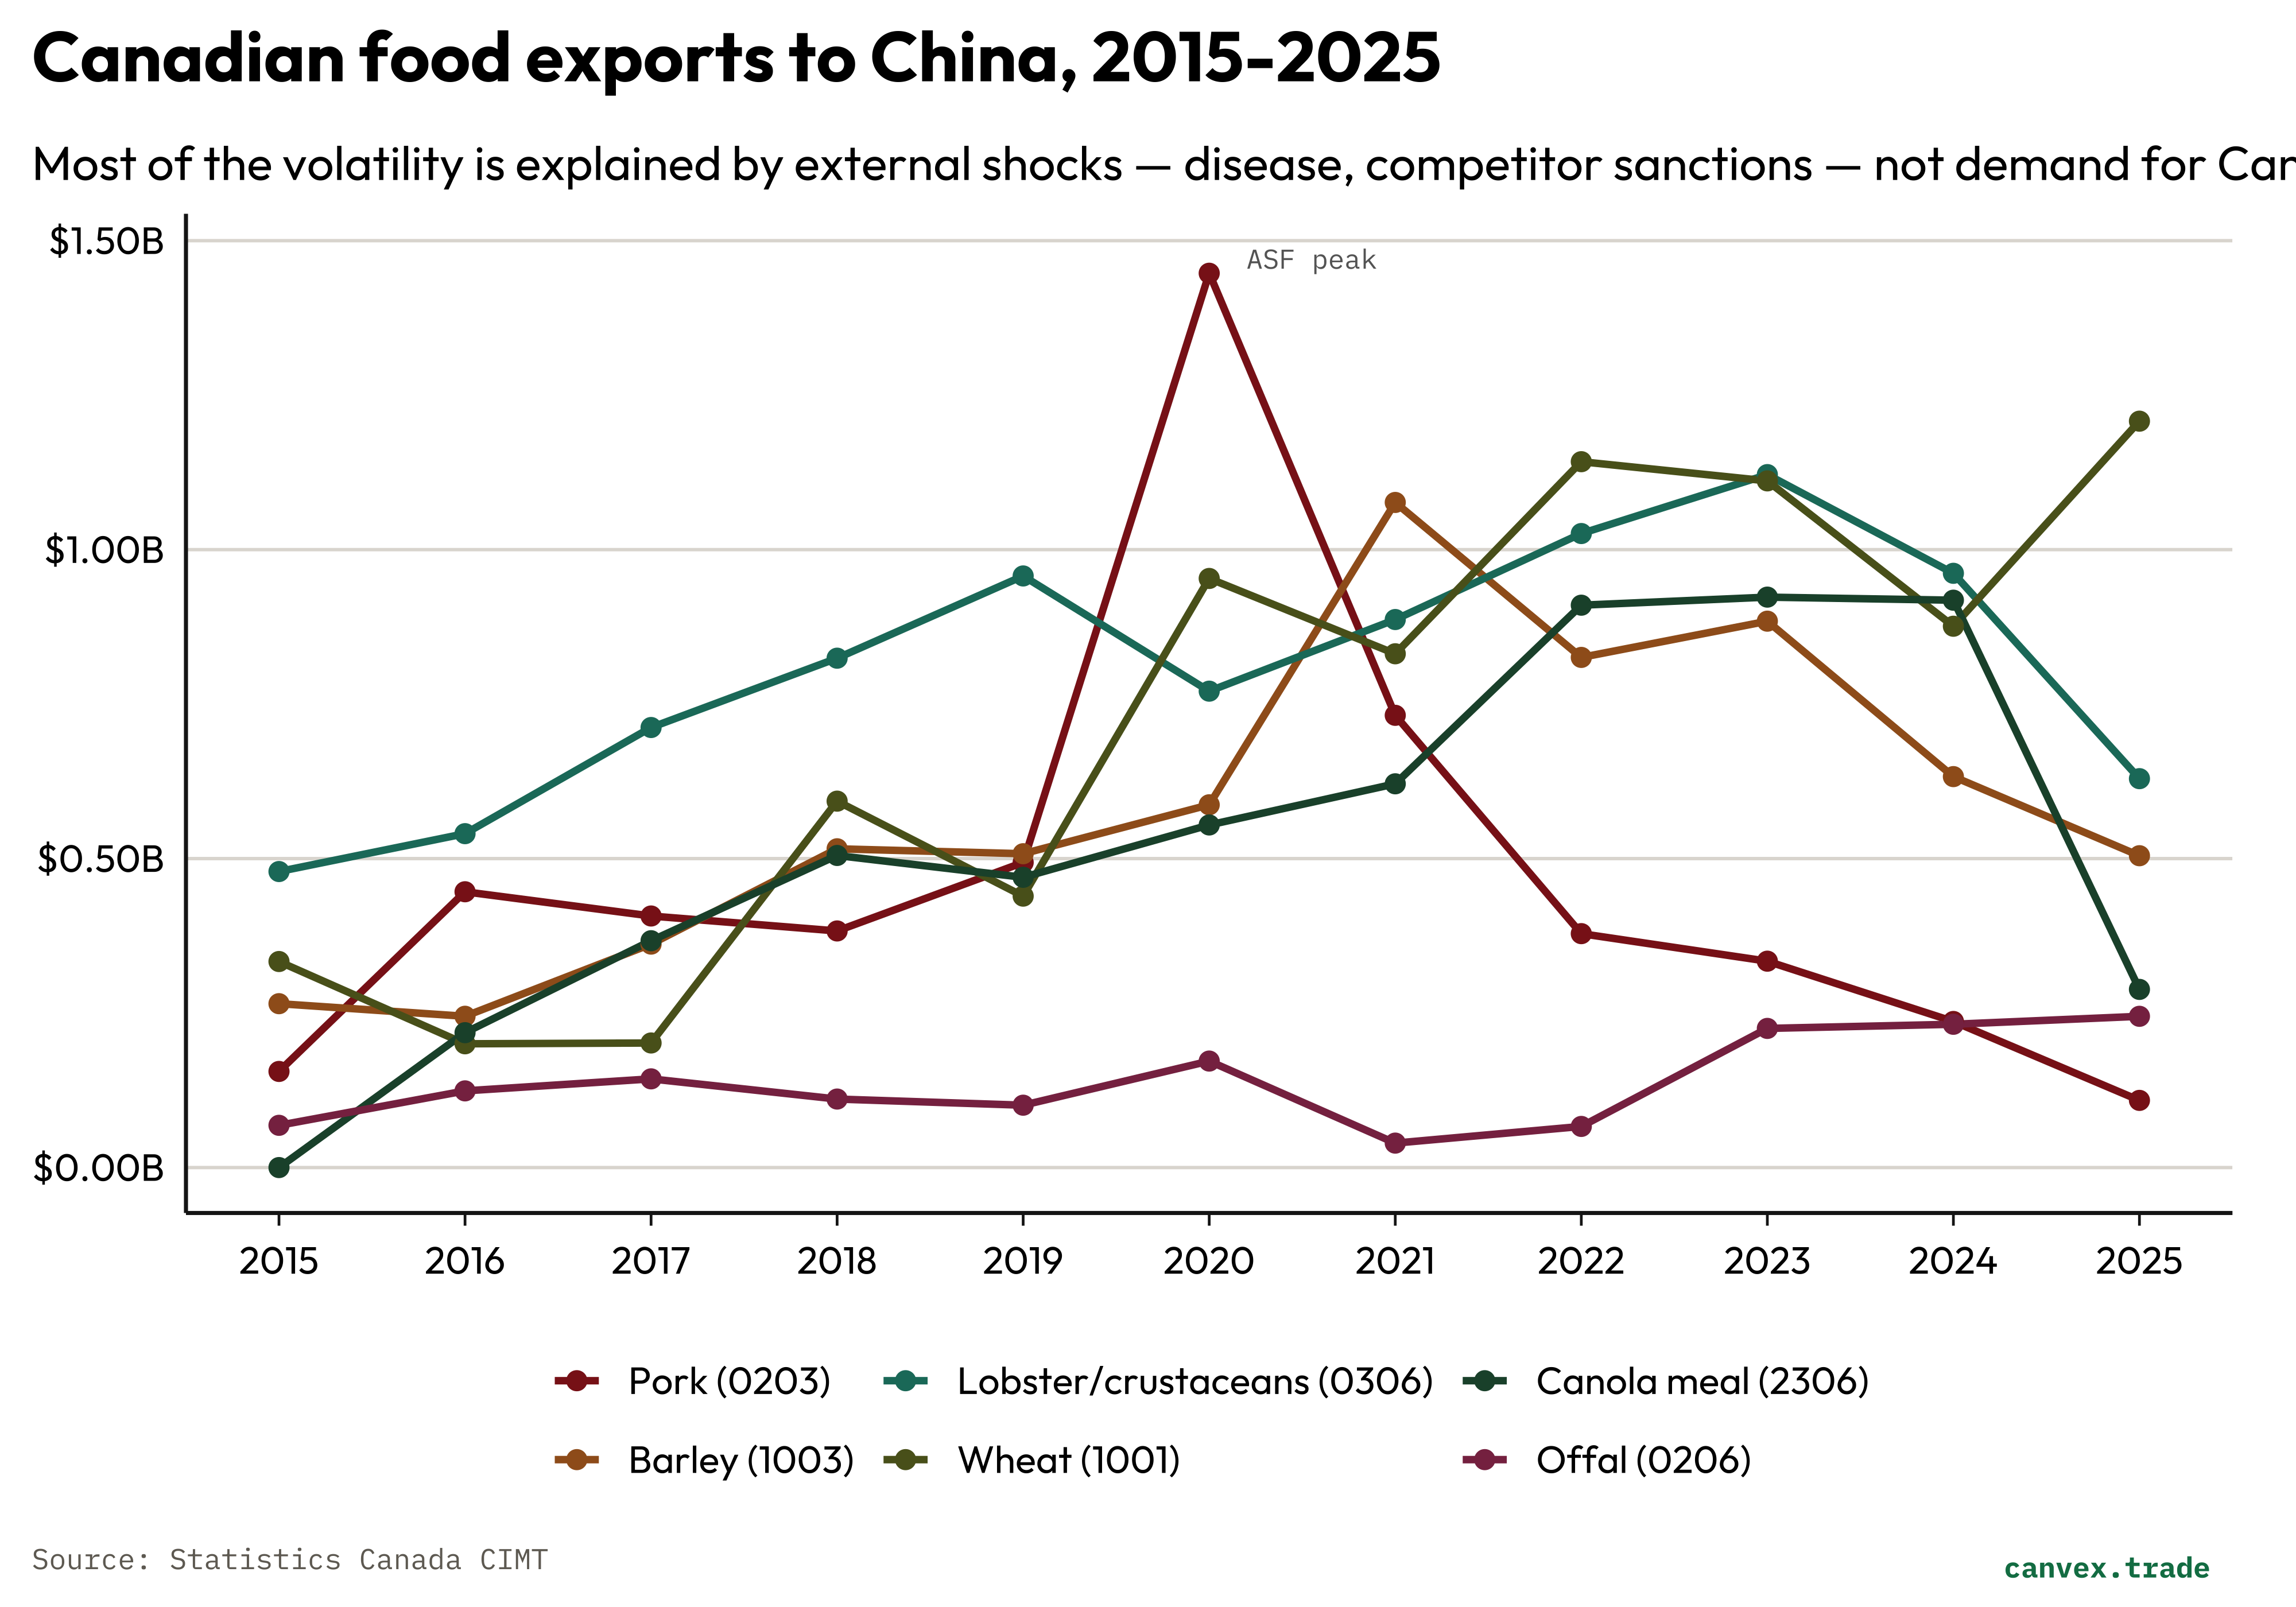
Wheat and barley are the most complex cases. Wheat exports grew from $333 million in 2015 to $1.21 billion in 2025 — reaching 11% of Canada’s total wheat exports. But China’s wheat import programme operates based on its own domestic harvest shortfalls, with Canada, Australia, and the US competing for the same purchases year to year. The channel is less politically vulnerable than canola because wheat imports flow through state trading enterprises rather than private import licences — but consistency is harvest-contingent, not brand-driven. Canada is one of several swing suppliers to a buyer managing its own production gaps.
Barley is a sharper version of the same dynamic. Exports grew steadily from $265 million (2015) to $516 million (2018), then spiked to $1.08 billion in 2021 — the year China imposed 80% tariffs on Australian barley following trade disputes, rerouting that demand toward Canada. The channel has since settled at $505-630 million, above its pre-2021 trend but below the displacement peak. Like coal in the energy corridors, this growth was created by a competitor’s misfortune rather than by Canada earning market share on merit. Its durability depends partly on whether the Australia-China rupture holds.
Canola meal (HS heading 2306) grew from near-zero to $918 million between 2016 and 2023, reflecting Chinese feed industry demand and the expansion of Canadian canola crushing capacity. It was abruptly disrupted in 2025, falling to $288 million, apparently under the same import licensing pressure that targets canola seed. A co-product of Canadian processing, classified differently under HS, proved no more insulated from the licensing mechanism than the raw input.
The honest picture across these six categories: Canada does export food to China, but not primarily on the terms the quality-supplier framing implies. The largest single-year surge in the dataset — pork in 2020 — was driven by a disease emergency and reversed when it ended. The largest sustained new entrant — barley — arrived through competitor displacement. The most valuable agricultural category — canola seed — is a raw crush input that China processes domestically, subject to termination with essentially no notice. Only lobster represents the kind of durable, consumer-anchored demand that the premium framing describes — modest in scale, but structurally real. The food corridor is less a relationship built on Canadian quality than a series of windows opened by external events, each of which closes on China’s timetable.
What the 35 years show
The full period contains a consistent pattern: China bought what it needed at each stage of its own development, from what Canada was already producing. In the 1990s, that was wheat and commodity pulp. Through the 2000s, it was iron ore, coal, and copper for the infrastructure build. In the 2010s, it was canola and oilseeds for the dietary upgrade of a growing middle class. In the 2020s, it is energy — first coal when Australian supply was disrupted, then crude as TMX opened a Pacific corridor.
The trajectory is not what a diversification strategy would produce. Canada did not build export relationships in China through market development investment, trade offices, or supply chain embedding. The relationship deepened because China’s underlying demand for raw materials — at prices set globally — was large enough to pull Canadian commodities across the Pacific. The policy question is whether that dynamic can be directed.
Three observations from the data worth holding:
First, the canola episode established a vulnerability template. Agricultural categories subject to import licensing can create specific exposure: a bilateral dispute can erase several billion dollars of exports in a single year without any formal tariff being imposed. The 2019 precedent is now part of the risk calculus for Canadian agri-food exporters. Canola has since recovered and even exceeded its 2018 peak — but the $3.7 billion single-year loss demonstrated the mechanism clearly.
Second, the 2025 energy surge reflects infrastructure, not policy. The TMX pipeline made Pacific crude export commercially viable. China became the primary buyer not through a diplomatic initiative but because it offered competitive prices and had the refinery capacity to process Alberta heavy crude. The copper ore growth tracks a similar logic: China’s green energy build-out creates durable demand for copper concentrates regardless of diplomatic conditions. The commodity relationship is, in this sense, more resilient than the agricultural one — it operates through price rather than licensing.
Third, the bilateral mix is now more resource-intensive than it has ever been. In 2025, fuels and ores combined — crude oil, coal, iron ore, copper ore — accounted for approximately 49% of Canada’s exports to China. In 1995, that figure was under 5%. The composition shift is structural: Canadian exports to China look progressively less like a developed-country bilateral and more like a classic extractive resource corridor. Whether that is acceptable depends on what one believes diversification is for.
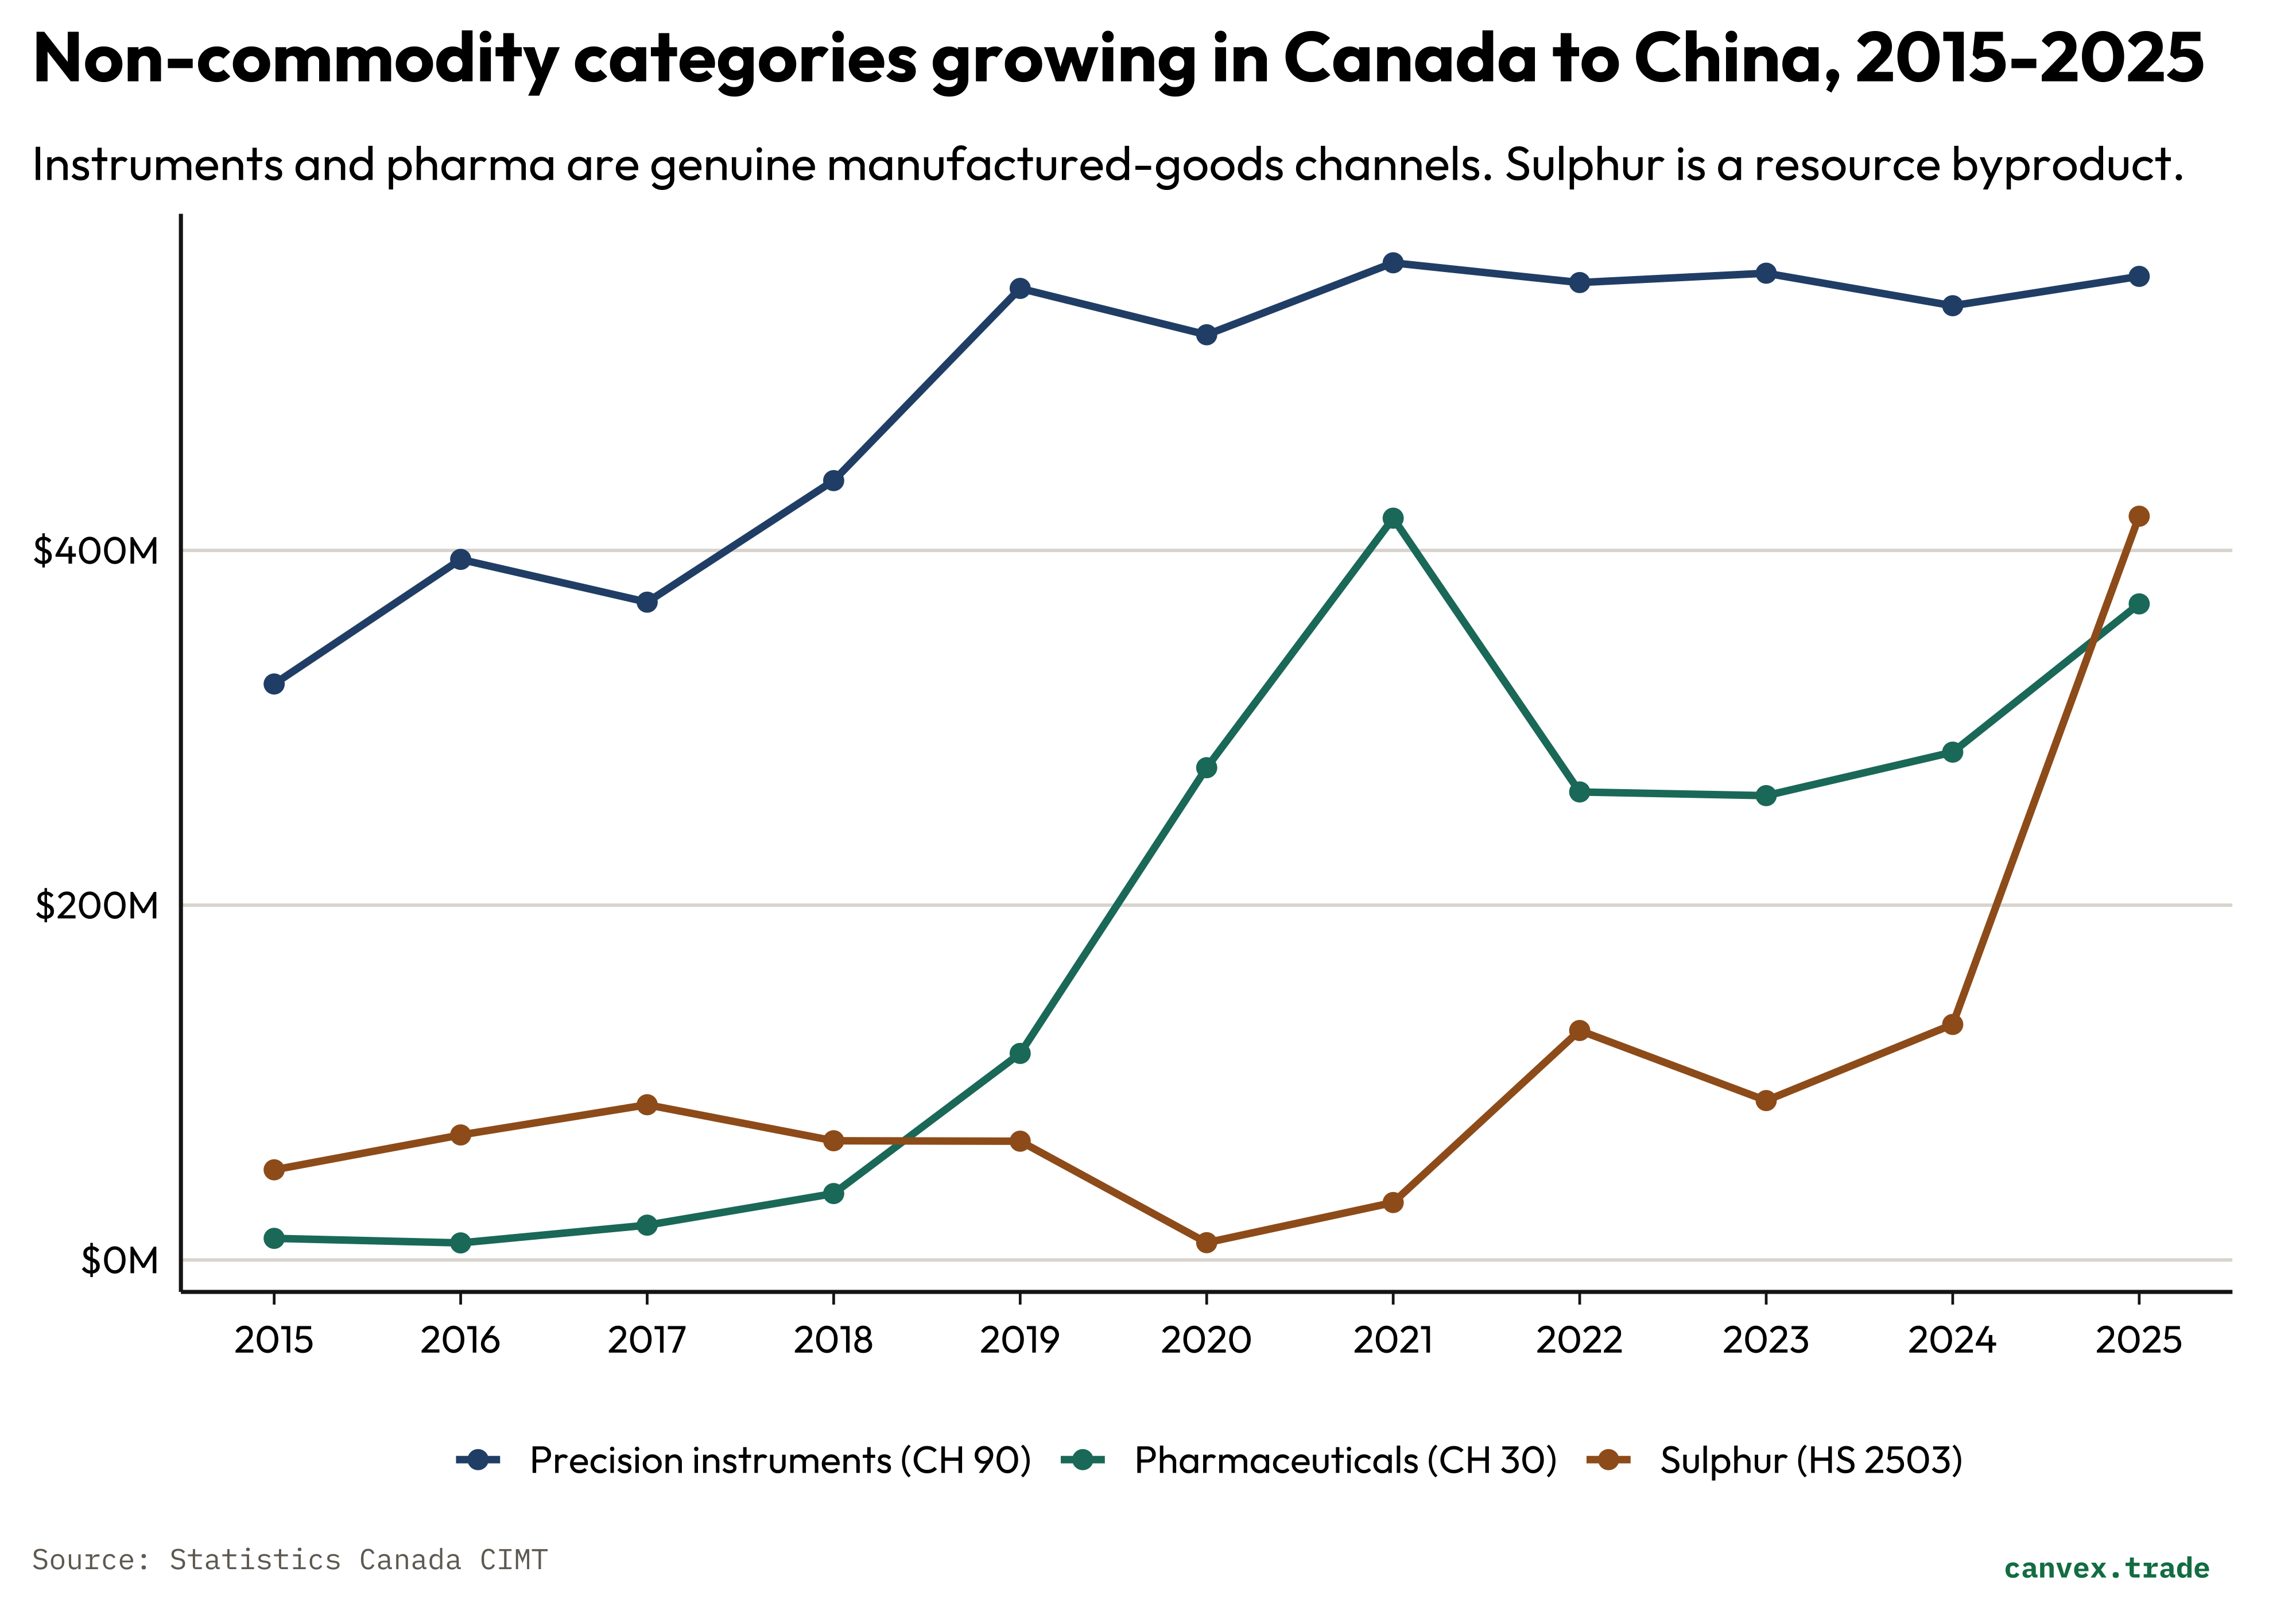
The non-commodity channels — and what they reveal
Examining the categories that sit outside the commodity core tests whether the primary-inputs framing holds everywhere or just at the aggregate level. The answer, across five growing channels, is that it holds almost everywhere — with two genuine exceptions.
Precision measurement and analytical instruments (HS chapter 90) grew from $320 million (2015) to $550 million (2025) — a 5.5% compound annual rate. The growth is concentrated in testing and measurement equipment (HS 9031: $72M → $198M), analytical instruments for physical and chemical analysis (HS 9027: $36M → $85M), and electronics testing oscilloscopes and spectrum analysers (HS 9030: $15M → $78M). These are manufactured goods, not commodity-linked, and the buyers are Chinese industrial and laboratory end-users. The channel exists because Canadian companies in sectors like mining equipment, photonics, and environmental monitoring have product lines that Chinese labs and manufacturers purchase. It is the clearest example in the bilateral data of a genuine value-added relationship — and at $550 million it remains modest against the $33.5 billion total.
Pharmaceuticals (HS chapter 30) grew from $12 million (2015) to $370 million (2025), with a COVID-era surge to $418 million in 2021 representing pharmaceutical inputs and medical equipment. The post-COVID level has held at $260-370 million — above the pre-pandemic trend — suggesting some permanent market access gain. Like instruments, this channel is not resource-indexed. Unlike instruments, its scale is still very small relative to Canada’s pharmaceutical production base.
Sulphur (HS heading 2503) grew from $51 million (2015) to $419 million (2025) at a 23% compound rate — but belongs on a different list. Alberta’s oil sands produce sulphur as a mandatory byproduct of hydrodesulphurization; China is a major sulphuric acid and fertilizer producer that imports elemental sulphur as feedstock. The compound rate reflects price and volume growth, but this is an extractive byproduct channel, one step removed from the oil sands. The Chinese buyer is a chemical processor. Canada supplies a raw industrial input.
Two additional fast-growing channels complete the picture — and both confirm the pattern rather than breaking it.
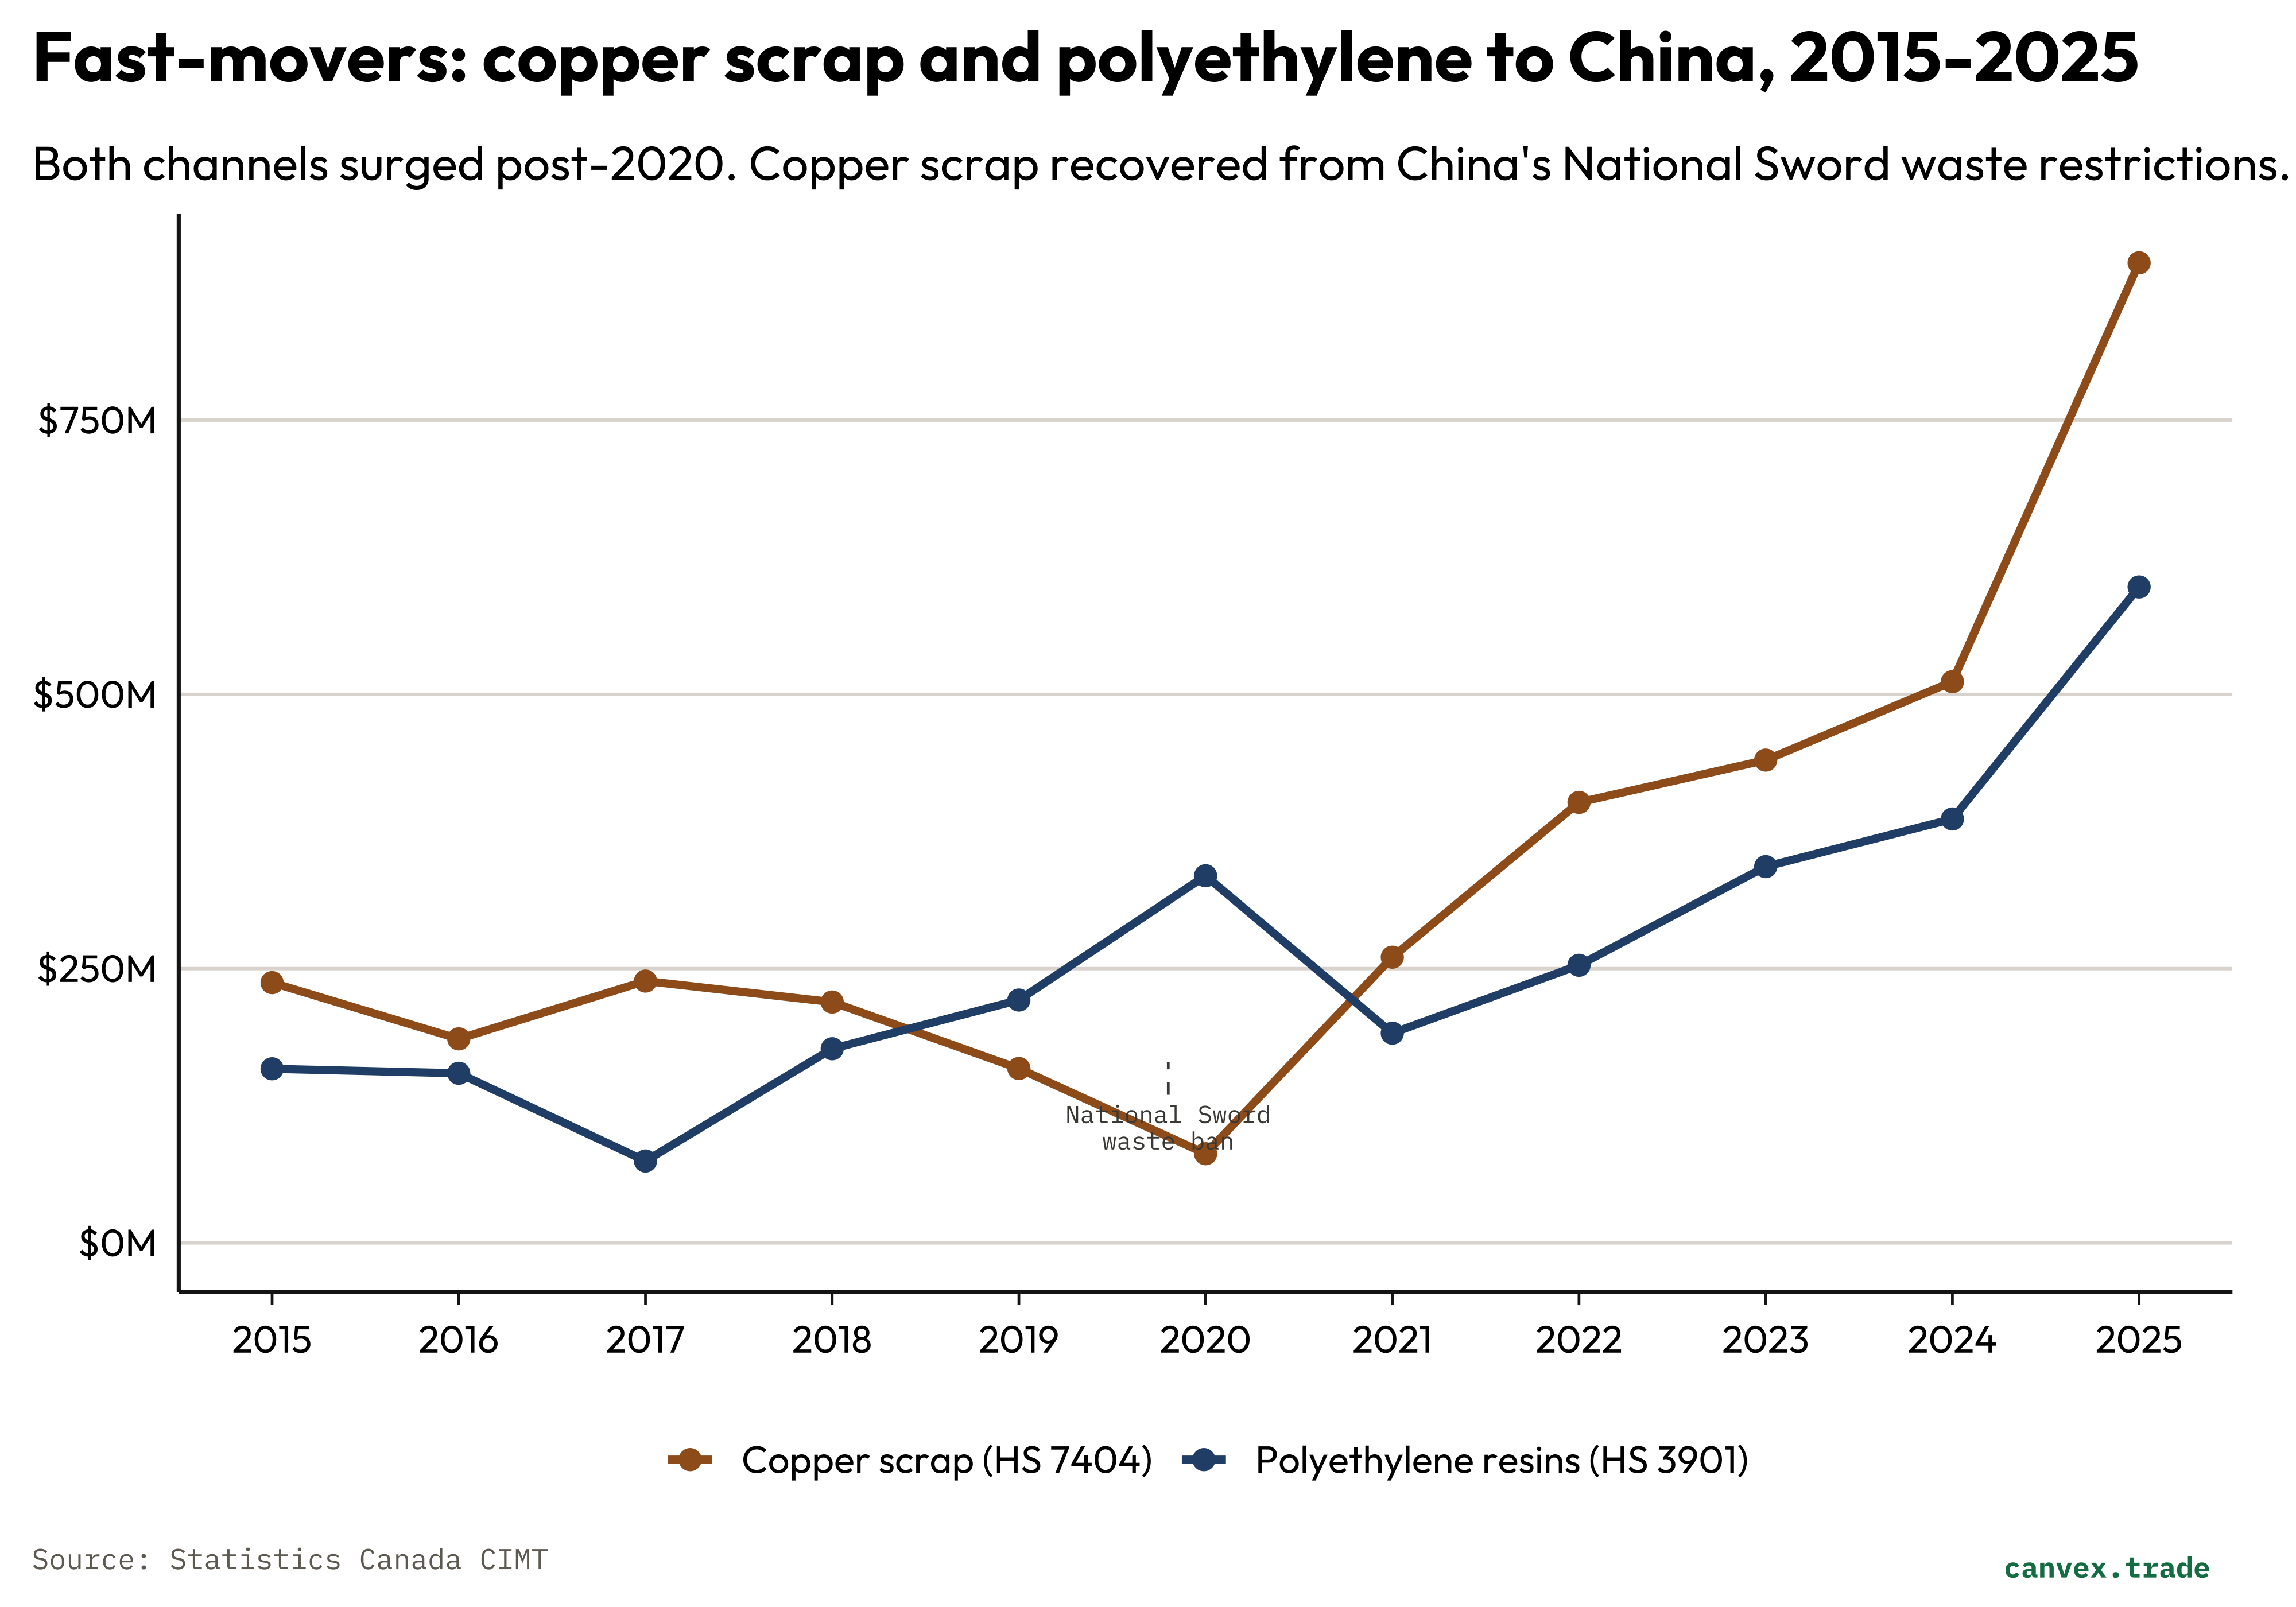
Copper scrap (HS heading 7404) went from $237 million in 2015 to $893 million in 2025 — a 14% compound annual rate, the strongest trajectory in the bilateral dataset outside of crude oil and ores. The product is copper waste and scrap from Canadian industrial, construction, and demolition sources, exported to China’s smelting and recycling industry. China is the world’s largest copper recycler, processing imported scrap alongside primary ore to feed its electrical infrastructure and EV supply chains. The channel collapsed in 2019-2020 (to $81 million) when China tightened scrap import standards under its National Sword policy, then recovered sharply from 2021 onward as China reformed its classifications to allow higher-grade copper scrap. The 2025 figure of $893 million is the channel’s highest level on record. Canada supplies the scrap; China captures the smelting margin.
Polyethylene resins (HS heading 3901) grew from $159 million in 2015 to $598 million in 2025, with China’s share of Canadian polyethylene exports rising from 3% to 11%. These are primary-form ethylene polymers — polyethylene pellets and granules used in packaging, pipe, and film manufacturing — produced at Alberta petrochemical facilities from ethane feedstock separated from oil sands and natural gas processing. The growth reflects both Alberta’s expanding petrochemical output (the Heartland Petrochemical Complex near Edmonton came online in 2021-2022) and China’s position as a major downstream plastics processor. Like sulphur, this is an Alberta energy economy story: a hydrocarbon processing byproduct finding a Chinese manufacturing buyer.
The honest read on diversification: Canada-China has not produced a significant manufactured-goods export relationship. Instruments ($550M) and pharmaceuticals ($370M) are genuine exceptions — Canadian-made products sold to Chinese end-users — but together they represent less than 3% of the bilateral total. Every other fast-growing channel, on examination, follows the same structural logic: Canada provides the raw or lightly processed material; China does the value-adding. Canola seed to crushing plants. Copper scrap to smelters. Polyethylene pellets to plastics converters. Sulphur to chemical processors. The employment and the margin sit downstream, in China.
That is not necessarily a permanent condition — the instruments channel in particular shows that Canadian industrial capability can find Chinese buyers where quality and specialization matter. But treating niche channels that run alongside a $30 billion commodity corridor as evidence of structural diversification would be premature.
The underlying data for this analysis is available in the interactive Canvex Trade dashboard — explore Canada’s export corridors by country, category, and year at canvex.trade.
Methodology
Dataset. Statistics Canada CIMT (Canadian International Merchandise Trade), HS-coded monthly data, 1990-2025. All values are nominal Canadian dollars; no inflation adjustment has been applied. Figures are reported on a customs basis (when goods cross the border), not a balance-of-payments basis.
HS classification. Canola and oilseeds are HS chapter 12. Canola meal is HS heading 2306. Iron ore is HS heading 2601. Copper ore is HS heading 2603. Copper scrap is HS heading 7404. Sulphur is HS heading 2503. Coal is HS heading 2701. Crude oil is HS heading 2709. Wood pulp is HS chapter 47. Polyethylene resins are HS heading 3901. Crustaceans are HS heading 0306. Pork is HS heading 0203. Edible offal is HS heading 0206. Wheat is HS heading 1001. Barley is HS heading 1003.
Coverage. CIMT captures goods trade only. Services trade — education, financial services, tourism — is not included and is reported under a separate Statistics Canada series.